Download
1 / 38
390 likes | 589 Views
Understanding functional diversity of brain regions and brain networks. Luiz Pessoa Department of Psychology Maryland Neuroimaging Center University of Maryland, College Park. Joint work with. Michael Anderson: Franklin & Marshall Lucina Uddin : Stanford/University of Miami

E N D
Understanding functional diversity of brain regions and brain networks Luiz Pessoa Department of Psychology Maryland Neuroimaging Center University of Maryland, College Park
Joint work with • Michael Anderson: Franklin & Marshall • LucinaUddin: Stanford/University of Miami • Josh Kinnison: University of Maryland
Structure-function mapping “fear” F1 F2 F3 F4 A1 A2 A3 A4 amygdala One-to-one mapping
Structure-function mapping “fear” “value” F1 F2 F3 F4 A1 A2 A3 A4 amygdala ventral striatum Many-to-manymapping
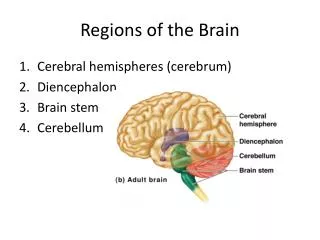
Structure-function mapping Emotion Cognition Motivation Perception Action … ?
Functional fingerprint Regions Passingham et al. (2002) Understanding brain regions via functional repertoires: multidimensional
Functional fingerprint Task domains (ontology) BrainMap NeuroSynth Understanding brain regions via functional repertoires: imaging data
Functional fingerprint Understanding brain regions via functional repertoires: imaging data
Functional diversity index Anderson, Kinnison, and Pessoa (2013), Neuroimage Regions will be more or less “diverse” Use Shannon Entropy
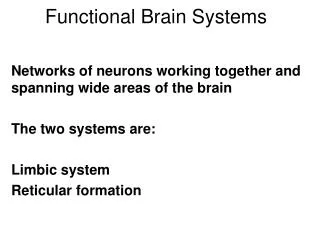
Functional diversity: networks Network fingerprint
Brain networks Toro et al. (2008) Fronto-parietal “attention” network (co-activation of BrainMap data)
Brain networks Toro et al. (2008) Cingulo-parietal “resting-state” network (co-activation of BrainMap data)
Understanding insula function Deen et al. (2010)
Understanding insula function Determine co-activation partners (using NeuroSynth) Uddin et al. (submitted)
Understanding insula function Determine co-activation partners (using NeuroSynth) Uddin et al. (submitted)
Understanding insula function Determine co-activation partners (using NeuroSynth) Uddin et al. (submitted)
Understanding insula function Common fingerprint All insula sub-sectors are highly diverse (cf. tripartite cognitive-affective-interoceptive scheme)
Understanding insula function “Specific” fingerprint components mean Sadness Happiness Fear … Phonology Working memory Reasoning … Left dorsal anterior insula
Understanding insula function “Specific” fingerprint components Dorsal Posterior Ventral “Cognitive” “Affective”
Brain networks Toro et al. (2008) Fronto-parietal: “attention” Cingulo-opercular: “resting-state” Dorsal attention: “endogenous attention” Ventral attention: “exogenous attention” Fronto-parietal: “rapid adaptive control” Cingulo-opercular: “stable set control” List goes on and on…
How to compare networks? Task positive Task negative
How to compare networks • Evaluate whether two sets (i.e., networks) of fingerprints are drawn from the same parent distribution • “Statistical energy” (Aslan and Zech, 2005)
How to compare networks X Y Statistical energy
Comparing networks Task-positive (co-activation; Toro et al. 2008) vs. Dorsal attention (resting-state; Yeo et al. 2011) Task-positive vs. Task-negative (co-activation data) Permutation testing of ϕXY
Are brain networks assortative? Assortativity: “like connects with like”
How to compare networks X Z Y • Statistical energy • “Functional distance” • Pairs of regions within a network • Pairs of regions between networks
Are brain networks assortative? Networks
Are brain networks assortative? “Dorsal attention”
Are brain networks assortative? “Ventral attention”
Are brain networks assortative? Dis-assortative “Default network”
Are brain networks assortative? Dis-assortative “Default network”: should fragment into several subnetworks
Summary Characterize contributions of individual brain regions and networks without using singular task-bound functional attributions Described quantitative property of networks – functional assortativity – that can be useful in understanding the functional and compositional similarities and differences between networks
Structure-function mapping Behaviors Cognitive Neural computations NC1 NC2 NC3 NC4 A1 A2 A3 A4 Brain areas Network 1 Network 2 Network 3 Pessoa (2008), Nature Reviews Neuroscience
Michael Anderson Josh Kinnison LucinaUddin Collaborators National Institute of Mental Health emotioncognition.org