Download
1 / 42
420 likes | 620 Views
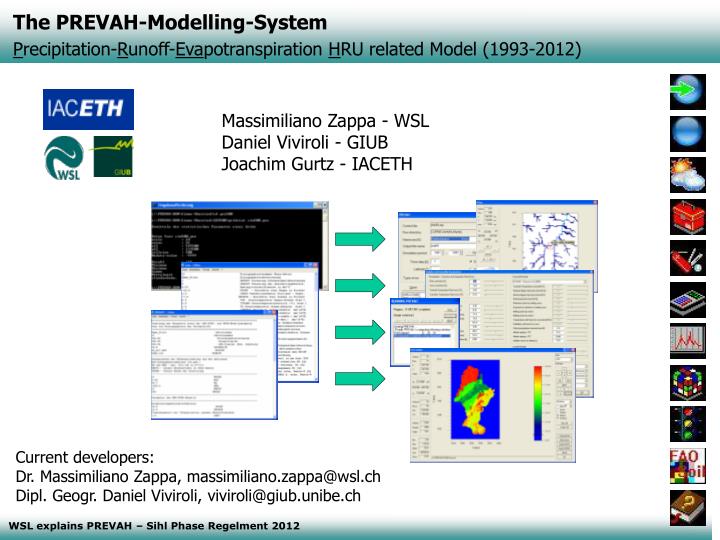
The PREVAH-Modelling-System P recipitation- R unoff- Eva potranspiration H RU related Model (1993-2012). Massimiliano Zappa - WSL Daniel Viviroli - GIUB Joachim Gurtz - IACETH. Current developers: Dr. Massimiliano Zappa, massimiliano.zappa@wsl.ch

E N D
The PREVAH-Modelling-System Precipitation-Runoff-Evapotranspiration HRU related Model (1993-2012) Massimiliano Zappa - WSL Daniel Viviroli - GIUB Joachim Gurtz - IACETH Current developers: Dr. Massimiliano Zappa, massimiliano.zappa@wsl.ch Dipl. Geogr. Daniel Viviroli, viviroli@giub.unibe.ch
The PREVAH-Modelling-System Precipitation-Runoff-Evapotranspiration HRU related Model PREVAH is / has ... ... a spatially distributed hydrological response units related watershed model ... a strongly conceptual description of the processes governing runoff generation ... flexibly manageable from the computational viewpoint ... designed to have modular structure allowing the use of different sub-models with different degree of complexly according to the avaialbility of input data.
The PREVAH-Modelling-System Precipitation-Runoff-Evapotranspiration HRU related Model PREVAH ... ... offers a users friendly set of tools for the pre-processing of the required physiogeographical, meteorological and hydrological data ... can provide a continuous simulation of discharge hydrographs including low flows and floods ... is able to provide spatially distributed data of runoff generation and of the most relevant storage elements of the surface hydrological cycle ... can be used at different spatial scales and can be coupled to different kinds of numerical models
The PREVAH-Modelling-System Precipitation-Runoff-Evapotranspiration HRU related Model Interpolated meteorology precipitation, air temperature, global radiation, water vapour pressure,sunshine duration Spatial information Elevation, Aspect, Landuse, Slope, Soil Properties, ... PREVAH HRU-Table Precipitation correction Sevruk (1986) Schulla (1997) Monteith (1975) Wendling (1975) Zappa et al. (2003) Menzel (1997) Gurtz et al. (2003) Site adjustment of radiation and temperature Evapotranspiration 1 hour or 1 day GIS - Grids Snowmelt / Icemelt Interception Soil moisture Runoff generation Calibration and Verification
The PREVAH-Modelling-System Viviroli et al., 2007
VIEWOPTIM / DOTTYPLOT - Evaluation of calibration runs PREVAH built-in semi automatic calibration PREVAH built-in MONTE-CARLO calibration routine
Required meteorological variables - data availability in Switzerland Precipitation [mm] Air temperature [°C] Global radiation [W/m2] Wind speed [m/s] Sunshine duration [-] Relative humidity [-]
WINMET - Interpolation of meteorological data Processing of data from Datawizard and generation of the meteorological input as required by PREVAH Results: Tables with meteorological information for each defined meteorological sub-unit. Data are assimilated and processed by PREVAH during each model run
WINMET - Selection of stations ANETZ Climatological Pluvimeters hourly 2–3 × daily 1 × daily
WINMET - Selection of stations ANETZ Climate Pluvios
Radar precipitation measurement in the AlpsCourtesy from Urs Germann, MeteoSwiss Red hues >40mm/h 138 Gauges 1 Radar 300 km
701-1250-00Hydrological processes and modelling PREVAH - calibration and verification Massimiliano Zappa Swiss Federal Research Institute WSL (Switzerland)
Calibration of PREVAH MODEL PARAMETERS Viviroli 2007
Initial Period (IP) Calibration period Validation period Validation period (VP) Calibration period IP VP1 Calibration period Validation period 2 IP 1 yr Basics on calibration (and verification) • hydrological models contain sets of parameters (k!) which might be adjusted: • to adapt the model to the area under investigation • to fit empirical concepts • available data sets should be divided into two not overlapping periods called: • calibration period (adjustment of parameters) • validation period (no further adjustment – only verification) • Some models request a starting period (initial period): - to fill up the initially empty storages (reservoirs) and - to reach a first equilibrium between all its components GIUB 2008
Automatic calibration of PREVAH Viviroli 2007
Automatic calibration of PREVAH - search strategy Viviroli 2007
Automatic calibration of PREVAH - recursive ... Viviroli 2007
Automatic calibration of PREVAH Default parameter-pairs for automatic calibration of PREVAH for Swiss glaciated catchments.
Automatic calibration of PREVAH - scores Nine scores are derived from the application of equations determining E2, E2log, DV to observed (Oi) and simulated (Si) data. The first three scores are determined by computing equations the three equations for the full calibration period. Six additional scores are introduced to improving the identification of robust parameter sets that provide a similar agreement for all the different seasons of the year and for all the years of the calibration period. Three scores are obtained by determining the standard deviation in the agreement between the single calibration years. Three more scores are determined by computing the standard deviation in the agreement of the twelve scores from the monthly sub-samples. All nine scores are reduced to a dimensionless index ranging between zero and one. The nine indexes are finally combined by adopting a weighted geometric mean. The weights can be defined by the user, who can for instance decide if the calibration procedure as to be more focused on achieving high E2, a low DVor a well balanced mixture of all nine indexes.
Automatic calibration of PREVAH - animation Viviroli 2007
Automatic calibration of PREVAH - evaluation Discharge, linear (MQ, HQ) Discharge, logarithmic (NQ) Error in water balance Total skill of the model
Automatic calibration of PREVAH - scores Total skill of the model
Previous to each model run all tunable parameters a selected randomly. Parameter distribution functions or parameter ranges are defined in order to constict the random sampling Scores (likelihoods) are computed as for the automatic (iterative) calibration. Advantages: Objective method Optima can be found in the whole parameter space. The "global optimum" can be identified Uncertainty in the parameter estimation is well declared Drawbacks: Very inneficient (non realistic parameter combinations are tested as-well) Large CPU-reqirments needed (10param runs!) Monte-Carlo simulations Viviroli 2007
Monte-Carlo simulations - examples Allenbach–Adelboden, 50'000 model runs with random sampling of the tunable parameters Viviroli 2007
Monte-Carlo simulations - examples "Very inefficient" (Example Allenbach–Adelboden): 49% of the parameter sets have Nash-Values < 0 86% of the parameter sets have Nash-Values < 0.5 Viviroli 2007
Multiple response verification The comparison of different outputs of a model run with selected observed variables allows a multiple-response verification of the model capabilities. Watershed models can be verified against ... soil moisture observations (Time Domain Reflectory) -> local ... water balance components from a weighting lysimeter -> local ... latent heat flux (Bowen Ratio, eddy correlation) -> local ... snow depth and snow water equivalent data -> local ... discharge data -> integral ... remotely sensed data of snow cover patterns -> 2D ... tracers, Natural Isotopes -> integral ... qualitative und quantitative 'Soft-Data' -> integral/local
Hochwassersteuerung Sihlsee MODUL 1 – Zuflussstatistik, PREVAH-Simulationen Sihlsee-Staumauer, www.sihlsee.ch.vu, Markus Bernet
Kalibration Seezufluss – Auflösung 100x100 m Landnutzung Gefälle
Kalibration Seezufluss – Auflösung 100x100 m Teilgebiete Hohenstufen
Kalibration Seezufluss – Basis Zuflüsse ScherrerAG, Tageswerte Input: MCH Stundenwerte/Tageswerte, 1999-2005 Aug - 2005
Kalibration Seezufluss – Basis Zuflüsse ScherrerAG, Tageswerte Input: MCH Stundenwerte/Tageswerte, 1999-2011 2007 Okt -2011
Zuflussstatistik – Tagessummen Mio m3 ScherrerAG PREVAH
Zufluss in Mio m3- Extremwertstatistik 72-Stundensummen 120-Stundensummen ScherrerAG PREVAH ScherrerAG PREVAH Grössenordnung: 888.7 bis 888.34 ~ 7 Mio m3
Zuflussstatistik – Tagessummen Mio m3 ScherrerAG PREVAH
Niederschlag und direkten Abfluss in Mio m3- gleitenden 72-Stundensummen
Niederschlag und direkten Abfluss in Mio m3- gleitenden 72-Stundensummen mit Abflusskoeffizient
Niederschlag und direkten Abfluss in Mio m3- Extremwertstatistik 72-Stundensummen 24-Stundensummen Grössenordnung: 888.7 bis 888.34 ~ 7 Mio m3