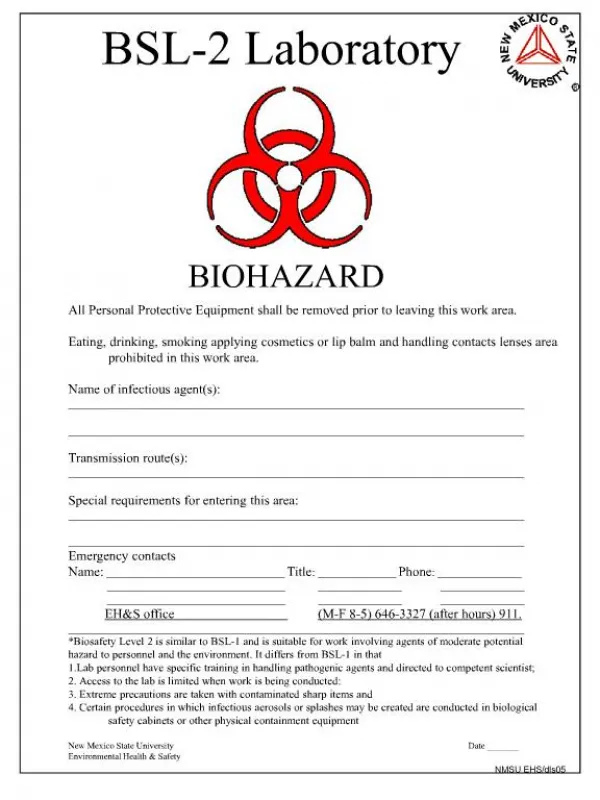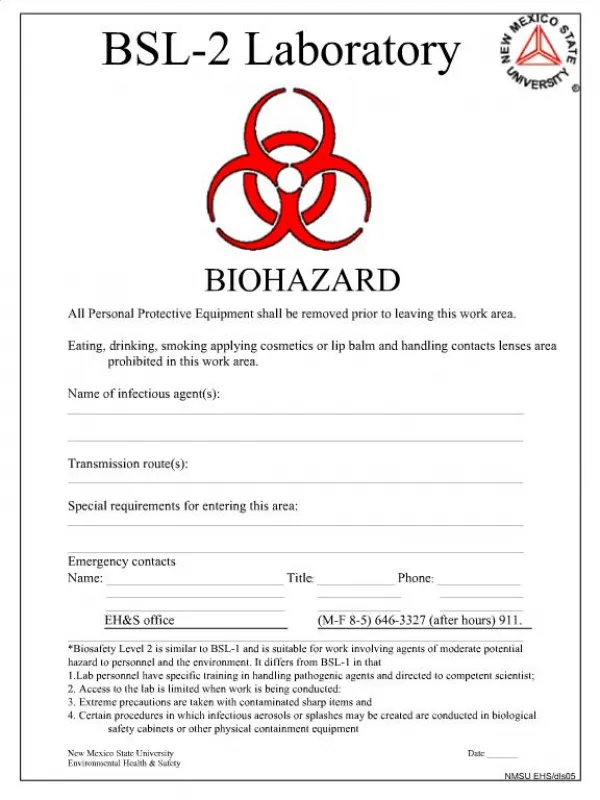
Laboratory 2
Laboratory 2. The conduction system of the heart and electrocardiography. Lab 2 Activities. Anatomy of the internal conduction pathway of the heart.

Laboratory 2
E N D
Presentation Transcript
Laboratory 2 The conduction system of the heart and electrocardiography
Lab 2 Activities • Anatomy of the internal conduction pathway of the heart. • Biopac Exercise L05-ECG-1: Normal electrocardiogram (including the names of all waves, intervals, and segments, what they mean, and how they correlate to the parts of the cardiac cycle).
Conduction System and Pacemakers • Autorhythmic cells • Cardiac cells repeatedly fire spontaneous action potentials • Autorhythmic cells: the conduction system • Pacemakers • SA node • origin of cardiac excitation • fires 60-100/min • AV node • conduction system • AV bundle of His • R and L bundle branches • Purkinje fibers It’s as if the heart had only two motor units: the atria and the ventricles!
The ECG: Electrode Placement Caution: Electrode clips are fragile; place cords where they will not be stepped on, in use, or when you are through!
The ECG Below are illustrated the waves (deflections) of a typical cardiac cycle. R P T Q S
The ECG Waves, intervals and segments of one cardiac cycle are illustrated below. QRS complex R P T Q PR (PQ) Interval S ST segment QT interval
BIOPAC NOTES • During calibration: • The subject should be sitting still*, hands resting in lap or on knees [BioPac says lying down; either is OK]. • If the beginning of the baseline is decreasing, redo the calibration. • The baseline should be more or less constant (horizontal) during calibration.
BIOPAC NOTES • During data collection (record – suspend – resume) • Treatment 1: Supine the bench top or three chairs or at least with feet elevated in a second chair; arms folded across waist if prone; hands on knees if sitting; breathing normally • Treatment 2: Sitting in a chair with arms at sides, hands in lap, and breathing normally • Treatment 3: Sitting in a chair doing deep breathing; record for 20 seconds after the first minute of deep breathing • Treatment 4: Record after one minute of running in place until the resting heart rate returns
BIOPAC NOTES Data Analysis • Ensure the boxes at the top are as depicted by the red arrow • Magnify image so that 2-3 cardiac cycles are visible.
BIOPAC NOTES Measure how long each event lasted • Delta T: Delta = Change, T = Time • The PR interval (PQ interval) is measured from the start of the P wave (not the top of P) to the start of the Q wave, but we will use Q, which is easier to identify
BIOPAC NOTES • Measure how long each event lasted • Be sure that you analyze and record results of 2 cardiac cycles for each treatment in your lab manual. • Tables 1 and 2, page 2-7 • Calculate the average of the 2 cycles! • Do not select cardiac cycles that are right next to each other. • Do your best to identify wave transitions. Be consistent!
BIOPAC NOTES • Measure the BPM for the same two cardiac cycles for each procedure • Use the I-beam to highlight one cardiac cycle and measure from the top of R to the top of R of the next cycle (R to R) to record the beats per minute rate for each treatment • Record results from 2 cardiac cycles for each treatment segment in Tables 1 and 2. • Calculate the average of the 2 cycles!
BIOPAC NOTES • Cardiac Cycle • Calculate by summing the appropriate intervals. • Rounding • Round your Delta T values for intervals and segments to two decimal places, e.g., 0.16. • Round your BPM values for Heart Rate to one decimal place, e.g., 72.1.
Your Assignment • Print a representative section (2-3 cardic cycles) of your ECG for the first set of treatment data (supine). • Label the waves, intervals, and segments of a typical cardiac cycle on the ECG you print. • Fill in Tables 1 & 2 as you analyze your data on page Lab2-7 of your lab manual. • Answer the questions on page Lab2-8. • No on-line homework this week.
BIOPAC NOTES Your graph should look like this. Then be sure you label the waves (P, Q-R-S, and T), intervals and segments(PR, ST, and QT) on the graph.