Download
1 / 21
210 likes | 383 Views
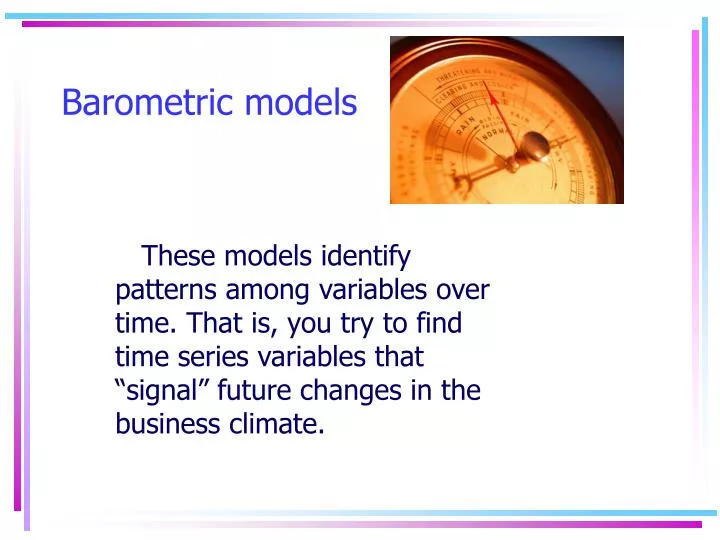
Barometric models. These models identify patterns among variables over time. That is, you try to find time series variables that “signal” future changes in the business climate. Forecasting Using Economic Indicators. Outline:

E N D
Barometric models These models identify patterns among variables over time. That is, you try to find time series variables that “signal” future changes in the business climate.
Forecasting Using Economic Indicators • Outline: • Components of the Conference Board’s leading, coincident, and lagging economic indicators. • Conference Board selection criteria • The record of the Leading Index in predicting recession and recovery. • The Ratio Index
The Leading Index (CLI) • The Composite Index of Leading Economic Indicators (CLI) is selection of time series variables that more often that not “lead” the cycle—that is, they tend to be in decline some months prior to a business cycle peak and tend to start rising months prior to a trough. • A discernible downturn in the CLI is a predictor of a coming recession. • An upturn in the CLI is an indication that the recession is nearly at an end.
Components of the Leading Index • Average weekly hours, manufacturing • Average weekly initial claims for unemployment insurance • Manufacturers' new orders, consumer goods and materials (in 1996 $) • Vendor performance, slower deliveries diffusion index • Manufacturers' new orders, non-defense capital goods (in 1996 $) • Building permits, new private housing units • Stock prices, 500 common stocks • Money supply (M2) (in 1996 $) • Interest rate spread, 10-year Treasury bonds less federal funds (yield curve) • Index of consumer expectations
Conference Board selection criteria for the CLI • Timing.Does the series have turning points spaced at lengthy intervals from cycle peaks and troughs, and is it consistent? The longer and more consistent the lead time, the higher the score for timing. • Conformity . How often does the series give off false alarms of impending turning points in the cycle? • Smoothness. Is the series choppy or erratic? • Currency.Is the most recent data readily available? • Statistical AdequacyRates the quality of the reporting system. • Economic Significance.Does the time path of this series make sense (at the level of theory) as a predictor of the future level of economic activity? • Revisions.Is there a strong likelihood that the most recently available data will be subsequently revised?
Scoring for 500 stock prices • Overall score is 85. • By way of comparison, the score for sensitive material prices is 66.
U.S. Index of Leading Indicators, 1987 = 100 CLI led March 2001 peak by 14 months -14
The CLI: How reliable are they? • From 1948 to 1988, the revised index of leading indicators had a average lead of 9 ½ months at business cycle peaks. • Lead times at peaks ranged from 2 to 20 months. • At business cycle troughs, the average lead is 4 ½ months. • Lead times at troughs ranged from 1 to 10 months. • The CLI set off false alarms of an impending business cycle peak and contraction in 1966 and again in 1984.
The CLI will tell you a recession or recovery is coming—but you won’t know when. Could be a month, or it could be 18 months. Also, a sharp decrease in the CLI (in percentage terms) does NOT necessarily mean the forthcoming recession will be a severe one.
Components of the Index of Coincident Indicators • Employees on nonagricultural payrolls(weight = .479) • Personal income less transfer payments (weight = .283) • Industrial production (weight = .129) • Manufacturing and trade sales (weight = .109) Recall we said the NBER looks to these indicators to date cycle peaks and troughs.
Composite Index of Lagging Indicators • Average duration of unemployment (weight = .037) • Inventories to sales ratio, manufacturing and trade (weight = .123) • Labor cost per unit of output, manufacturing (weight = .062) • Average prime rate (weight = .243) • Commercial and industrial loans (weight = .128) • Consumer installment credit to personal income ratio (weight = .221) • Consumer price index for services (weight = .186)
The Ratio Index (RI) • Let C denote the composite index of coincident indicators. • Let L denote the index of lagging indicators. • The ratio index is given by: • RI = C/L
Comparing the Performance of the CLI and the Ratio Index in Predicting Post-War Recessions