Download
1 / 22
230 likes | 365 Views
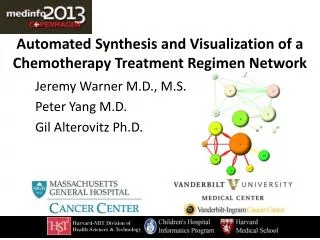
Harvard-MIT Division of Health Sciences & Technology. Automated Synthesis and Visualization of a Chemotherapy Treatment Regimen Network. Jeremy Warner M.D., M.S. Peter Yang M.D. Gil Alterovitz Ph.D. Background and Motivation. Most cancer contexts have multiple treatment options.

E N D
Harvard-MIT Division of Health Sciences & Technology Automated Synthesis and Visualization of a Chemotherapy Treatment Regimen Network Jeremy Warner M.D., M.S. Peter Yang M.D. Gil Alterovitz Ph.D.
Background and Motivation • Most cancer contexts have multiple treatment options. • E.g. 20+ NCCN® recommended regimens for adjuvant treatment of breast cancer • Few direct comparisons. • Thus, guidelines are usually derived by expert opinion. • Guidelines outdate rapidly. NCCN: National Comprehensive Cancer Network
Network Meta-Analysis • A variety of methods to quantitatively compare multiple treatment options • Methodology is still evolving in this area • We proposed to investigate: • Visualization of chemotherapy regimens (vertices) including summative efficacy • Visualization of relationships between regimens (edges), including quality of comparisons • Automated network layout for readability http://www.bmj.com/content/342/bmj.d1199
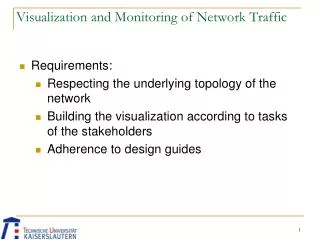
Leveraging Network Attributes • Layout • Vertex size, color • Edge color, width, duplication • Transparency versus
Vertex Attributes 100 10 • Size: proportionate to N enrolled • Color: gradated tri-color schema • Inferior treatment regimen • Regimen of equivocal value • Superior treatment regimen • Transparency: dynamic “aging” effect • Assigned initial alpha of 1.0 and decayed by 0.1/year to a minimum of 0.2 • Refreshed to 1.0 if/when new RCT uses regimen
Vertex Coloration • Calculated by a “contest” between regimens: • Win (E = 1): superiority, as defined by an improved outcome with p-value ≤0.05 • Lose (E = -1): inferiority, as defined by an inferior outcome with p-value ≤0.05 • Tie (E = 0): either an outcome with a non-significant p-value or an equivalent outcome as defined by formal non-inferiority, with p-value ≤0.05
Edge Attributes • Width: proportionate to # patients compared • Duplication • Color • Weak surrogate measure (e.g. RR; RV = 1) • Strong surrogate measure (e.g. PFS; RV = 1.25) • Overall survival (RV = 1.5) • Transparency: same as for vertices PFS: Progression-free survival RR: Response rate RV: Relative value
Vertex Coloration Example • Hehlmann et al. (1993): Randomized comparison of busulfan and hydroxyurea in chronic myelogenous leukemia: prolongation of survival by hydroxyurea. The German CML Study Group. • Busulfan (BU, N=216) median survival: 45.4 months • Hydroxyurea (HU, N=225) median survival: 58.2 months HU BU
Node Layout • Determined by the Kamada-Kawai force-based algorithm. • Some manual modification to improve readability. • Layout fixed by final state; historical graphs can be viewed as subsets. http://en.wikipedia.org/wiki/File:Visualization_of_wiki_structure_using_prefuse_visualization_package.png Kamada T, Kawai S. Information Processing Letters. 1989:7-15.
Proof-of-concept • First-line treatment of chronic myelogenous leukemia (CML) • Relatively few treatment options, but they have been rigorously tested.
Search Results • 197 publications identified through PubMed • MeSH: Leukemia, Myelogenous, Chronic, BCR-ABL Positive • Publication Type: Randomized Controlled Trial • 24 RCTs were identified between 1968-2012 • 17 unique regimens MeSH: Medical subject headings RCT: Randomized controlled trial
Temporal Growth of Patients Enrolled, Vertices and Edges Cumulative enrolled patients: 9700 Cumulative vertices: 17 Cumulative edges: 40
Conclusions • Network meta-analysis demonstrates the dynamic evolution of treatment regimen evidence for untreated CML. • Over time, the quality of RCT evidence degrades as surrogate outcomes are substituted. • Older regimens, e.g. IFNA-LoDAC, may retain usefulness. • These findings are in close parallel to the NCCN Guidelines ®.
Limitations and Future Directions • Some manual curation remains necessary • Non-randomized information is omitted • Phase I, I/II, and II studies • Single arm and CER analyses • Toxicity and cost information missing • Toxicity: can sometimes trump efficacy with chemotherapy regimens • Monetary Cost: newer regimens often costs a great deal more for various reasons. • Non-monetary cost: e.g. infusion room time CER: Comparative effectiveness research
Example: Toxicity vs. Efficacy Récher C, et al. Lancet. 2011 Nov 26;378(9806):1858-67
Example: Toxicity vs. Efficacy “Grade 3–4 haematological toxic effects were more common in the R-ACVBP group, with a higher proportion of patients experiencing a febrile neutropenic episode (38% [75 of 196] vs 9% [16 of 183])” Récher C, et al. Lancet. 2011 Nov 26;378(9806):1858-67
Value Equation • Challenge: Incorporate these multiple dimensions into a coherent visualization