Download
1 / 37
370 likes | 555 Views
NCEP Operational Global Cyclone Tracking and Verification System. Guang Ping Lou, Geoff DiMego, Tim Marchok, Binbin Zhou, Mike Charles NCEP/EMC/MMB EMC seminar Nov. 4, 2008. 1. The Ideas. What are needed:

E N D
NCEP Operational Global Cyclone Tracking and Verification System Guang Ping Lou, Geoff DiMego, Tim Marchok, Binbin Zhou, Mike Charles NCEP/EMC/MMB EMC seminar Nov. 4, 2008
1. The Ideas What are needed: • A global cyclone tracking system. Existing tracker is confined to North America and adjacent oceanic basins. • A real time cyclone track verification system that gives feedback to forecasters and modelers.
1. The Ideas (cont.) Challenges: • In order to do track verification, the “truth” is needed. In the tropical case, NHC puts out storm vitals, the best observed tracks as the “truth”. However, there is none-existence in the extra-tropical regions. Operationally, it is laborious at best, and almost impossible to manually identify all cyclone tracks in the middle latitudes.
1. The Ideas (cont.) Solution: • Utilization of existing resources to create “truth” for verification. That is, model analysis tracks are used as the “truth”, which are embedded to the track output files. Stringing them together will form analysis tracks. Schematic Diagram:
00hr Forecast 00hr 00hr 00hr 00hr 00hr 24hrs 48hr 72hrs 96hrs 120hrs 00Z 12Z 00Z 12Z 00Z 12Z 00Z 12Z 00Z 12Z 00Z 24hr 48hrs 72hrs 96hr 120hrs Verification • Extra-Cyclone Tracks Verification: • 1.Extra-Tropical cyclone verification will use analysis as the truth since observed cyclone tracks are not available. • Therefore the tcvitals are already contained in the output of the forecast tracker after it completes the tracker processing. The first three records in the output file are the analysis position and intensity of the cyclone. • Position, center pressure, and/or direction, and wind strength for each quadrant are possible variables for verification every 12(24) hours. Mean errors of these variables can be calculated in the interval of 12(24) hours on a monthly bases and/or continuously (moving average).
1. The Ideas (cont. ) Advantages: 1. The system is objective; 2. It is a completely automated system and no human intervention is needed from identifying both analysis and forecast tracks to verification, plotting and web displaying; 3. Provide a quick look at how well the forecasts are against the analysis tracks; 4. It can be used to generate retro-run tracks and verification easily. Disadvantages: 1. The analysis tracks are often short lived due to weakening and observation data ingest in each synoptic time; 2. The tracks can only be verified against model self analysis because matching difficulties against another model analysis.
2. Tracking Algorithm • Single-pass Barnes analysis scheme is used to locate the cyclone center. • Barnes analysis equation:For a variable F, the Barnes analysis B, at a point g, where Where dn is the distance from a data point n to the grid point g, and re is the e-folding radius. Typically an re value of 75 km for models with a grid resolution finer than 1.25 degree and 150 km for those with coarser resolution.
2. Tracking Algorithm (cont.) • Tracking parameters are: mslp, 700 and 850hpa relative vorticity, and geopotential height and winds at 700 and 850hpa. The Barnes analyses of these 7 parameters determine the tropical cyclone center. For middle latitude cyclones, only mslp is used to determine the center. • To minimize the iterations, after one parameter center is located, the other four parameters are restricted to smaller domains. • For next forecast center position, an extrapolation of previous locations is computed and current storm advection according to winds is calculated. • Other criteria are applied to the searched position so that it is indeed a cyclone center. Such as vicinity of previous position; pressure gradient, etc.
2. Tracking Algorithm (Cont.) • Phase space: The 3 diagnostics from Robert Hart's cyclone phase space. The three parameters used to described the general structure of cyclones are the lower-tropospheric thermal asymmetry (parameter B), the lower-tropospheric thermal wind and the upper-tropospheric thermal wind (cold versus warm core). Cyclone thermal symmetry parameter B: Where h = 1 for northern hemisphere and h = -1 for southern hemisphere.
2. Tracking Algorithm (Continue) Lower-tropospheric thermal wind: Upper-troposheric thermal wind: Where d: the distance between the geopotential extrema
Old regional tracker: Include only CONUS, Atlantic basin, West Pacific basin, East Pacific basin, and Alaska, mainly north America-centric; Single CPU does all processing. Regional search needs as much as 3.5 hrs wall clock. Storm ID has no continuity. New global tracker: From -90~90, 0~360, lat & lon, truly global coverage; Multitasking schemes to have as many tasks as number of ensemble members. Global search finishes within 20 minutes wall clock. Users have much earlier access to tracks. New storm ID is named with initial date, lead-time in forecast and lat/lon position where storm was first identified. 3. Differences Between Old Regional and New Global Trackers
4. Regular atcf text output with limited parameters. 4. In addition to regular output, added phase parameters: Positions for the 3 diagnostics from Bob Hart's cyclone phase space. Mean & max values of relative vorticity near the storm at 850 & 700. Direction of model storm motion, Translation speed of model storm, The pressure of the last closed isobar and the radius of that closed isobar. 5. TIGGE web format output. (THORPEX Interactive Grand Global Ensemble) 3. Old Regional And New Global (Cont.)
Tracking: Operational tracker is invoked whenever model forecast data arrive at NCO. The forecast models include GFS, NAM, CMC, UKMO, ECMWF, NOGAPS, and ensemble forecasts such as NCEP ensemble GEFS and SREF, CMC and ECMWF. Cyclone tracks are plotted and graphics are pushed to a web server. They are also archived in ATCF, MySQL format and TIGGE format. http://www.emc.ncep.noaa.gov/mmb/gplou/emchurr/verify/ 4. The Steps
4. Steps (cont.) b) Getting the analysis tracks: • Model analysis ATCF data are picked out from the forecast tracks. • Search nearby cyclone center in the next synoptic time. The criteria for recognizing as the same cyclone are: 3.5 by 4.5 lat and lon in middle to low latitudes; 4.5 by 5.5 lat and lon in high latitudes. Set aside preliminary storm tracks. • Search for cyclones that are weakened and then re-appeared within 12 hours in the vicinity areas. • Another iteration that string fragmented analysis storm tracks to form a unique track that will span the cyclogenesis to die out.
4. Steps (cont.) c) Matching forecasts with analysis tracks: • Separate each forecast track into independent files. • Search for analysis cyclone track that matches the forecast track. • Combine the forecast and analysis tracks into one file. Operationally, previous 10 day’s cyclones are lined up for verification. Climatologically, uniquely paired cyclones are stored in a monthly database. This database is also converted to MySQL format. d) Verification.
5. What Is Running in NCO Operations • Currently there are 6 single models and 4 ensemble track runs are in operations. Trackers run in different time and various frequencies depending on the model. Starting time is immediately after the model data become available. All tracker runs are carried out by NCO. • After each tracker run, a cron job starts to produce forecast track plots, analysis track plots, track verification and plots, web display. • GFS: Tracker runs 4 times a day at 00Z, 06Z, 12Z, 18Z. • NAM: 4 times a day at 00Z, 06Z, 12Z, 18Z. • ECMWF: 2 times a day at 00Z, 12Z. • UKMET: 2 times a day at 00Z, 12Z. • CMC: 2 times a day at 00Z, 12Z. • NOGAPS: 2 times a day at 00Z, 12Z. • GEFS: 4 times a day at 00Z, 06Z, 12Z, 18Z. 21 members. • SREF: 4 times a day at 03Z, 09Z, 15Z, 21Z. 21 members. • CENS: 2 times a day at 00Z,12Z. 17 members. • EENS: 1 time a day at12Z. 50 members.
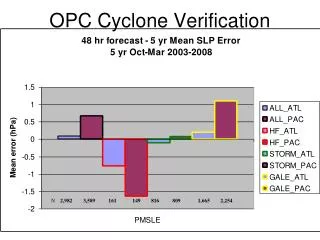
7. Verification and Schemes Position error and bias: OB1-3: Observed positions FC: Forecast position DX: Error in the East-West direction DY: Error in the North-South direction AT: Error in the Along Track direction CT: Error in the Cross Track direction DX=Xo-Xf : DX errors are positive if the forecast position lies westward of obs DY=-(Yo-Yf) : DY errors are positive if the forecast position lies poleward of obs PE=SQT(DX*DX+DY*DY): Position error
7. Verification and Schemes (cont.) Following conventional tropical storm verification procedure, cyclone tracks are arranged in two separate decks: • Adeck, contains past 10 day’s forecast tracks. • Bdeck, holds analysis tracks that match the forecast’s. • Verification is done for both track position errors and intensity errors, RMSE, x, y biases, amongst other stats. In the examples shown previous slides, track errors are calculated as displayed next.
8. Climatology of Cyclone Tracks • Monthly statistics of forecast position error, x-bias, and y-bias • Seasonally and yearly statistics
9. Summary and Discussion • Established a new automated cyclone track verification system: • Replacing regional tracker with a new global cyclone tracker • Shortened track delivery time from 3.5 hours to within 30 minutes for ensemble tracks • Created tracks database in ATCF text, MySQL, TIGGE formats, and increased content of the output files • Tracks climate verification • Upgraded web display capability 1. Tracking forecast cyclone tracks 2. Seeking out analysis tracks 3. Matching forecast with analysis tracks 4. Verification 5. Plotting and pushing plots to server
9. Summary and Discussion (cont.) • ECMWF model is most accurate overall in forecasting the cyclone position • GFS fairs very well within 48 hours forecasts, but overtaken by CMC and ECMWF models after that. • NAM has largest position errors. Most of it comes from moving too fast for forecasting cyclones. • Position errors in other models mainly come from north-south displacement • But GFS is less consistent in forecasting east-west position – tends to oscillate between too fast and too slow.