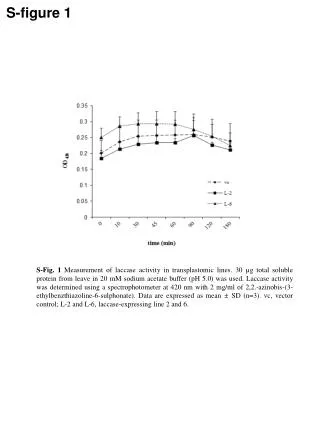
Effects of TNF-α and IL-1β on Oxidative Stress Markers in a Controlled Study
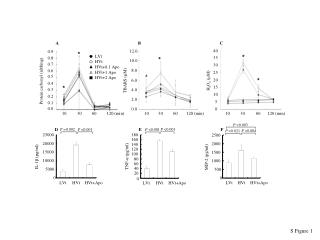
This study investigates the impact of inflammatory cytokines TNF-α and IL-1β on oxidative stress markers such as TBARS, H2O2, and protein carbonyls in vivo. Experimental data is presented at various time points (10, 30, 60, and 120 minutes) to discern the cytokines' influence on these oxidative stress indicators. Statistical analysis reveals significant differences (P < 0.001) in the levels of inflammatory factors and their correlation with oxidative stress responses. These findings may enhance our understanding of inflammation's role in oxidative damage.

Effects of TNF-α and IL-1β on Oxidative Stress Markers in a Controlled Study
E N D
Presentation Transcript
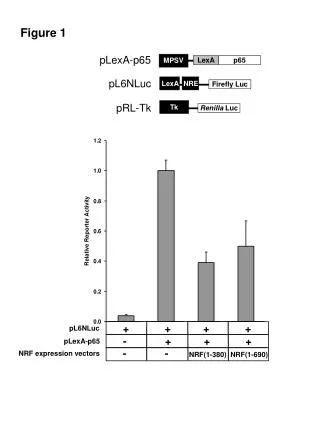
* * * # * * P =0.003 D F E P =0.002 P <0.001 P <0.001 P <0.001 P =0.004 P =0.021 180 25000 2500 160 20000 2000 140 120 15000 1500 100 TNF-α (pg/ml) IL-1β (pg/ml) MIP-2 (pg/ml) 80 10000 1000 60 40 5000 500 20 0 0 0 LVt HVt HVt+Apo LVt HVt HVt+Apo LVt HVt HVt+Apo 40 12.0 0.9 A B C 35 0.8 10.0 0.7 30 8.0 0.6 25 0.5 20 6.0 TBARS (µM) H2O2 (µM) Protein carbonyl (nM/mg) 0.4 15 0.3 4.0 10 0.2 2.0 5 0.1 0.0 0.0 0 120 (min) 10 30 60 120 (min) 10 30 60 120 (min) 10 30 60 LVt HVt HVt+0.1 Apo HVt+1 Apo HVt+2 Apo S Figure 1