Download
1 / 25
250 likes | 397 Views
Integrated Modeling of the Interactions Between Climate Change, Forest Biomass, Wildfire Emissions and Air Quality. U. Shankar 1 , A. Xiu 1 , and D. Fox 2 , L. Ran 1 , B. H. Baek 1 , N. Davis 1 , S. Arunachalam 1 , B. Wang 1 , D. Mckenzie 3 , S. McNulty 4 , J. M. Meyers 4 , J. Prestemon 5

E N D
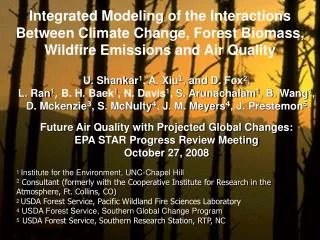
Integrated Modeling of the Interactions Between Climate Change, Forest Biomass, Wildfire Emissions and Air Quality U. Shankar1, A. Xiu1, and D. Fox2, L. Ran1, B. H. Baek1, N. Davis1, S. Arunachalam1, B. Wang1, D. Mckenzie3, S. McNulty4, J. M. Meyers4, J. Prestemon5 Future Air Quality with Projected Global Changes: EPA STAR Progress Review Meeting October 27, 2008 1Institute for the Environment, UNC-Chapel Hill 2 Consultant (formerly with the Cooperative Institute for Research in the Atmosphere, Ft. Collins, CO) 2 USDA Forest Service, Pacific Wildland Fire Sciences Laboratory 4 USDA Forest Service, Southern Global Change Program 5 USDA Forest Service, Southern Research Station, RTP, NC
Research Program Goals • Project funding: EPA STAR Grant RD 83227701 • Aim: support the EPA Global Change Research Program goals by • Examining consequences of climate change for wild fire occurrence and consequently for U.S. air quality • Combining the effects of climate change with forest growth to examine impacts of changes in fuel loads on wildfire emissions • Investigating the impacts of evolving fire and biogenic emissions from 2002-2050 on air quality • Currently in no-cost continuation (end date: March 2009)
Outline • Background • Modeling System Overview • Model Applications • Forest Growth Model (PnET) Simulations and Fuel Projections • Future Year Projections of Fire Activity • Air Quality Simulations and Aerosol Radiative Impacts • BlueSky – SMOKE Emissions Modeling • Nested METCHEM Simulations • Conclusions • Tasks Remaining
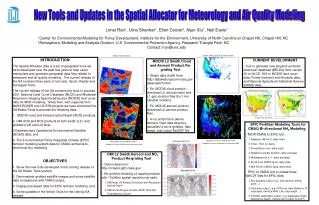
Air Quality and Climate Impactsof Fires • Impacts of wild fires felt at the regional and global scale • Black carbon => positive climate feedback (warming); SO2 emissions => negative climate forcing from secondarily produced SO4 • Effect of radiatively important pollutants on short-term climate variability affects forest growth, biogenic emissions and future fuel loads CO O3 CarbonaceousAerosol Effects of Canadian boreal fires on CO, PM and ozone from a July 1995 simulation
Predictive Modeling Issues • Current fire inventoriesdo not captureclimate impacts on forest biomass and fuel loads • best estimates are from 5-year history • effects not reflected in biogenic land cover data • Feedback of scattering and absorbing aerosols and ozone to atmospheric dynamics not captured in most air quality simulation models • Understanding these effects is essential to fully assess impacts of fires on air quality and climate and the net benefits of fire management plans
Integrated Modeling System Monthly met. Fire Scenario Builder CCSM Base & future year fuel data Initial & boundary met. PnET-II Hourly met METCHEM (MM5-MCPL / MAQSIP) FIA FCCS BlueSky/EPM MEGAN SMOKE Fire activity data Anthropogenic inventoried emissions Gridded & Speciated Emissions
Forest Growth Model • PEcon forest growth and economics model has been used by the USFS Southern Global Change Program to model 13 states in the Southeast • Ecological process model of forest productivity, species composition, and hydrology (PnET II); predictions of forest biomass scaled up from the FIA plot level to the county level • SGCP provided PnET model and inputs for 11 SE US states from 1990-2198 for the project
Flow Chart of PEcon Climate Spatial FIA Update Equilibrium UpdateInventory Volume1 PnET-CN SRTS Volume2 Allocate Harvest Calculate Growth Volume3 Calculate Acres Harvested Update Acres FIA Plot Inventory and Harvest
PnET Modifications • Expanded inputs to 13 states with new country-level data for site parameters (EESI-Penn State) and climate parameters (NCEP [historic] and CCSM [future, CO2 increases under IPCC - B2]) • Computed county center location, elevation, and water holding capacity for modeling at county level • Initialized with species groups biomass and fuel data (2000 FIA data) in all states at the county level • Modified output to add LAI, foliar NPP, wood NPP, root NPP, plot ID, year, month, forest species and other variables
PnET Linkages to Fuel Estimates • BlueSky-EM uses 2 fuel-related input files • 114 FCCS fuel bed classifications at 1 km grid resolution (54 fuel bed types in the Southeast) • fuel load look-up table for DWM, grass, shrub and canopy fuels in various size classes • Developed a cross walk between FIA species groups and FCCS fuel beds for DWM (coarse and fine woody debris, litter, herb/shrubs, slash, duff, and fuel bed depth) and canopy fuels • Attempts to correlate live biomass to current DWM, and related data (latitude, elevation, temperature, RH, winds) at county level using SAS data mining tools did not yield good correlations • Found DWM variability to be better associated with stand disturbances and climate than with live biomass • Future-year simulations thus use a constant DWM • Updated canopy fuels as a fixed proportion of total simulated biomass • For the relatively young forests in SE US we assumed this to be 10%, with an upper limit of 20 T/acre
PnET Linkages to Biogenic Emissions Model • PnET outputs monthly biomass and LAI for 203 forest species at plot and county level • Will use the MEGAN model to import PnET output for estimating biogenic emissions • MEGAN takes gridded monthly LAI and climate data with plant function type and emission factor files to estimate gridded biogenic emissions • Includes isoprene (O3 precursor), mono- and sesquiterpenes (PM precursors)
Future-year Projections of Fire Activity • Fire activity data for 2002 from state-level fire reports converted to the model grid for lightning- and human-induced ignitions as annual gridded values • Future-year annual area burned projected using a statistical model (Prestemon and Mercer, FS SRS) from 2002 values to 2020, 2030 and 2050 • Human- and lightning-inducedignitions were correlated to population and income level changes, as well as met variables from MM5 (monthly means of WSmax, Tmin) • Gridded annual area burned estimates apportioned to daily values for the fire season using a modified version of the Fire Scenario Builder (McKenzie et al., 2006); flammability based on fuel moisture calculated by the NFDRS • Uniform probability of fire for fuel moisture < 25%
Projected Annual Acres Burned (Southeast) from Human-induced and Lightning lgnitions
Flammability Ignition Avail Human- and lightning-induced ignitions Fire Generator MM5 (mesoscale model) Fire frequency & fuel maps Management RxFire/suppression NFDRS Equations predict fuel moisture in fuel size classes that carry fire. Fire Starts Daily Fire Sizes Fire Scenario Builder
BlueSky/SMOKE Simulations • BlueSky smoke emissions model linked to SMOKE for merging with emissions from other sources • Directly linked to the FCCS fuel database • Jan and Jul 2002 simulations at 12-km for SE U.S. • BlueSky simulations have just been completed for 2002 and 2020 • The SMOKE processing is underway for July 2002 • Results are preliminary, need calibration through AQ simulations at 12-km
Coupled Meteorology-Chemistry Model (METCHEM) Aerosol Direct Radiative Feedback H & V Transport, Cloud Physics & Chemistry, Gas/Particulate Chemistry, PM Microphysics (Modal), Dry & Wet Removal (MAQSIP CTM) Meteorology (MM5) Met. Couple (MCPL) Emissions Processing (SMOKE)
METCHEM Simulations • ConUS METCHEM simulations are underway for 2002 using EPA NEI 2002 emissions inventory • Evaluation against IMPROVE and STN show significant regional bias with underprediction of PM in the summer • Used to extract boundary condition inputs for SE domain • Began 12-km Southeastern US simulations to test the BlueSky/SMOKE output and evaluate against network obs • Next proceed to 1-month simulations in Jan and Jul 2020, 2030 and 2050 to analyze effects on key climate parameters
36-km PM Concentrations – Summer 2002 All sites West East
36-km SO4 Concentrations – Summer 2002 West East
Conclusions • Forest Biomass/Fuel Load Uncertainties: • No spatial changes in vegetation species across the landscape • Constant expansion factor for species biomass from plot to county • Assumed constant mortality and removal rates • Used 10% of biomass for canopy fuel for all forest types • Uncertainties in Fire Activity Estimates • Mismatch in IPCC scenario used in fuel estimates and annual area burned estimation • Assume uniform probability of ignition throughout the fire season, and no variability in dependence on fuel moisture
Conclusions (cont’d) • The PM composition is predicted better at low concentrations, and in general, in urban sites in the West • Uncertainties in emissions inputs, particularly in 36-km simulations due to lack of adequate fire emissions for Canada and Mexico in NEI 2002 • Sulfate underbias suggests lack of adequate spin-up in the model • Low values of other unspeciated PM could be due to insufficient wind-blown dust emissions
Tasks Remaining • Complete the emissions processing for the base and future years • Complete the air quality simulations • Examine the 550 nm aerosol optical depth and compare to MODIS AOD’s (available on the 12-km grid) • Improve the estimates of biogenic emissions from MEGAN by more fully accounting for changes in land cover type due to fires • Perform sensitivities on future fire emissions by refining the daily fire area estimates