Download

1 / 33
330 likes | 459 Views
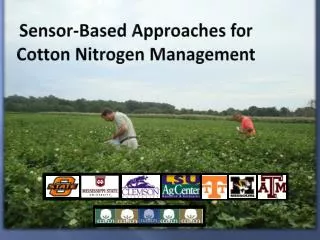
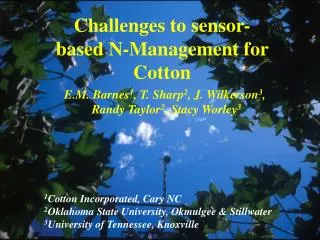
Sensor-Based Approaches for Cotton Nitrogen Management. Outline. Introduction 2008 Sensor Projects Sensor-based approaches to manage nitrogen Core data collection. Cotton Belt. USDA, NASS. Cotton and Nitrogen. Perennial plant managed as annual Indeterminate flowering pattern

E N D
Outline • Introduction • 2008 Sensor Projects • Sensor-based approaches to manage nitrogen • Core data collection
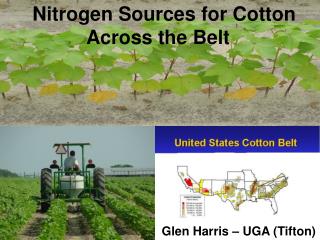
Cotton Belt USDA, NASS
Cotton and Nitrogen • Perennial plant managed as annual • Indeterminate flowering pattern • 50 lbs N – per lint bale (1 bale = 480 lbs) • Over-application of N: • Energy partition to vegetative vs. reproductive development • Large plants prevent efficient harvest • Growth regulators applied to control vegetative development
2008 Sensor Projects + other sensor + other sensor + other sensor + other sensor custom sensor
Sensor-Based Approaches Relate yield potential with sensor readings and a well fertilized nitrogen plot Direct regression relationship between sensor reading compared to a reference nitrogen plot A growth stage specific relationship between the sensor reading and N rate Relationship between historic yield, soil type and the sensor reading
Relate yield potential with sensor readings and a well fertilized N plot
SBNRC AlgorithmOSU – Arnall et al. • N Rate = (YP0 * RI – YP0) * %N / NUE • potential cotton lint yield, kg/ha = 235.96 e 2216.2 * INSEY • cotton lint yield, kg/ha = 177.41 e 2216.2 * INSEY • Where: • Yield Prediction Model: YP0 = 235.96 e 2216.2 * INSEY • Response Index: RI = 1.8579 * RINDVI – 0.932 • %N = 0.09 • Nitrogen Use Efficiency: NUE = 0.50
LSU AgCenter Implementation of OSU approach (Tubana et al.) • Initiated in 2008, 3 sites in North Louisiana • Growth stage: two weeks after early bloom • INSEY is defined as NDVI divided by the number of days from planting to sensing
LSU AgCenter Implementation of OSU approach (Tubana et al.) • This study also consider the impact of PGR (applied at early bloom) on the yield relationship.
Clemson Modification of OSU Approach (Khalilian et al.) • Soil specific yield by INSEY relationships (soil electrical conductivity categories) • Coastal plain soils of South Carolina • INSEY was calculated as days from emergence to date of sensing.
Direct regression relationship between sensor reading compared to a reference nitrogen plot
Missouri (Scharfet al.) • Best-band-ratio predictor of economically optimal nitrogen rate
Missouri (Scharf et al.) • Calculating N rate based on NDVI and refNDVI: • Crop Circle 210: N rate (lb/ac) = 573 - [549 x (NDVI/refNDVI)] • GreenSeeker: N rate (lb/ac) = 760 - [732 x (NDVI/refNDVI)] • Cropscan: N rate (lb/ac) = 691 - [673 x (NDVI/refNDVI)] • Ceilings on total N rate are use: • 200 lbs N/ac for heavy soils (clay, clay loam) • 150 for other soils • Farmers decide on lowest and highest N rates for the system (within the ceiling)
A growth stage specific relationship between sensor readings and N rate
Mississippi (Varco et al.) • Relationship between GNDVI or NDVI at a specific stage of growth and fertilizer N rate • Leaf N approach (graph): Utilize N rates to that produce leaf N values at various physiological stages
Mississippi (Varco et al.) • Example of established relationship at the third week of squaring (experimental data): Fertilizer N rate equivalence (FNRE) = -999.562 + 1584.984(GNDVI or NDVI on-the-go value) • Variable N rate = FNRE (experimental data) – target rate • Ceilings on total N rate (cutoff values)
Relationship between historic yield, soil type, and sensor readings
Tennessee (Wilkerson et al.) • Bracket the response of real-time nitrogen prescription algorithms • Incorporate a map of historic information: identify areas within a field as historically low or high yielding and increment/decrement the N prescription accordingly • Additional agronomic data to determine the size of increment or decrement in response to yield potential is needed.
Texas (Sui et al.) • Canopy chlorophyll content index (CCCI) – relative estimate of the chlorophyll content in a crop canopy • CCCI accounts for variation in canopy density and less likely to give false indications of low chlorophyll content (vs. simple ratio or NDVI) • Well-suited for the three-band sensor (Crop Circle)
Core Data Collection • Develop a simplified yield potential nitrogen rate estimate – under discussion. • Producer usable approach - 2010
Core Data Collection Growth stages for plant data collection: Early squaring: 3 to 7 squares Early bloom: 2 to 3 blooms Mid bloom Peak bloom Nitrogen rates: 0, 90, and 120 lb N/ac
Core Data Collection Soils data set (Mehlich-3 P & K, soil NO3) Preplant samples Post-harvest samples
Core Data Collection Within season plant information: Sensor readings
Core Data Collection Within season plant information: SPAD readings and plant height Tissue samples for leaf N
Hand harvest – 13.3 ft of row Machine – 40 feet of 2 rows Determine seed cotton and lint weight Seed N content Yield Data Collection
Other Record Keeping Varieties Planting and harvest dates Nitrogen rates, timing, application methods and N sources PIX rates and dates (if applicable) Irrigation amounts (indicate in furrow, pivot, drip) Rainfall
Take Home Notes • One or more of these approaches should be ready for extended on-farm evaluation in 2010. • Will this end with one concept: analysis of core data: • correction procedures (thermal time, days from planting to sensing etc.) • components (yield potential, response index, simple ratio)