Download
1 / 31
350 likes | 857 Views
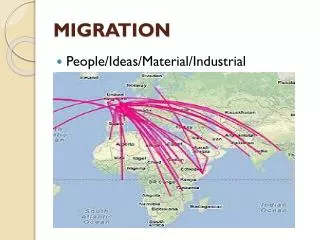
Migration. AP Human Geography Unit 2. Migration Terms. Mobility Circulation—“ short term” Migration (vs. Circulation) Emigration Immigration Net Migration Net in-migration: Immigrants > Emigrants: Net out-migration: Immigrants < Emigrants. CIA Worldfactbook , April 2006.

E N D
Migration AP Human Geography Unit 2
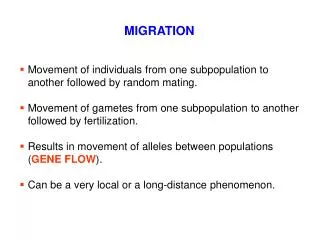
Migration Terms • Mobility • Circulation—“short term” • Migration(vs. Circulation) • Emigration • Immigration • Net Migration • Net in-migration: Immigrants > Emigrants: • Net out-migration: Immigrants < Emigrants CIA Worldfactbook, April 2006
Net-migration Using the Population Data Sheet… • Identify the three countries with the highest “net in-migration” rate. • Identify the three countries with the highest “net out-migration” rate. • What problems does using the rate versus the raw number present?
E.G. Ravenstein’s “Laws of Migration” • Most people migrate for economic reasons. • Cultural & environmental factors may also be important, but not as important as economics • Most migrants move a short distance, and stay within a country. • Long-distance migrants go to major centers of economic activity. • Most long-distance migrants are males. • Most long-distance migrants are adults, not families with their children. **Theory of Human Migration:1885**
Causes of Migration • Push vs. Pull Factors • ECONOMIC • North Dakota Oil Boom • CULTURAL • Iraq War (2003-present) • ENVIRONMENTAL • Hurricane Katrina (2005)
Why did people migrate to the USA? Pull Push Overcrowding in Europe Overcrowding in Europe Overcrowding in Europe Plenty of food in USA Plenty of food in USA Plenty of food in USA Persecution of Russian Jews Persecution of Russian Jews Persecution of Russian Jews Poverty in Europe Poverty in Europe Poverty in Europe The US Bill of Rights The US Bill of Rights The US Bill of Rights Higher pay for US workers Higher pay for US worker Check Answers Higher pay for US workers European class system European class system European class system Religious freedom in US Religious freedom in US Religious freedom in US
Refugee Who is a refugee? In the US [under the Immigration and Nationality Act, Section 101(a)(42)]: • The term 'refugee' means: (A) any person who is outside any country of such person's nationality … who is unable or unwilling to return to, and is unable or unwilling to avail himself or herself of the protection of, that country because of persecution or a well-founded fear of persecution on account of race, religion, nationality, membership in a particular social group, or political opinion, or (B) in such circumstances as the President … may specify, any person … who is persecuted or who has a well-founded fear of persecution on account of race, religion, nationality, membership in a particular social group, or political opinion.
Refugee Global Refugees—There are about 20,000,000 refugees or internally displaced personsworldwide, (estimates vary a lot).The top 10 sources of refugees, asylum seekers and internally displaced persons in 2005 were: • Afghanistan: 1,908,100 • Sudan: 693,300 • Burundi: 438,700 • DR Congo: 4430,600 • Somalia: 394,800 • Vietnam: 358,200 • Palestinians: 349,700 [or more than 4,300,000, depending on definitions] • Iraq: 262,100 • Azerbaijan: 233,700 • Liberia: 231,100
Refugee US Refugees: 2003-2006—The ceiling on US refugee admissions is 70,000 per year. 2003 2004 2005 2006 Africa 20,000 25,000 20,000 20,000 East Asia 4,000 6,500 13,000 15,000 Eastern Europe 2,500 nanana The Former Soviet Union 14,000 nanana Europe &Central Asia na 13,500 9,50015,000 Latin America & Caribbean 2,500 3,500 5,000 5,000 Near East & South Asia 7,000 2,0002,500 5,000 Unallocated Reserve 20,000 20,000 20,000 10,000
Migration Patterns • Wilbur Zelinsky… Demographic Transition • Migration patterns change depending on demographic stage • Stage 2—international migration, also rural to urban migration • Stage 3 & 4—internal migration, also urban to suburban , the destination of those in stage 2 • Gravity Model • Step Migration
Migration Terms Intervening Obstacle— “Lee Model” • Environmental (oceans) • Cultural (laws) International Migration • Voluntary vs. Forced Migration • “Chain migration” Internal Migration • Interregional Migration • Intraregional Migration (ie. rural to urban, Counterurbanization) U.S. side of the border is uninhabited and separated from Mexico by a fence
Migrant Characteristics Is Ravenstein still correct? • Today, in the US, most international immigrants are women, not men. • Although most immigrants to the US are still single adults, increasing numbers of immigrants are children (17 years of age or less). • Mexican migrants to the US come from the interior. Why do we see changes?
Global Migration Patterns • Only 5% of the world’s population are international migrants (still more than 300 million people) • Net out-migration areas: Asia, Latin America and Africa • Net in-migration areas: North America, Europe, Oceania
US Immigration Patterns 1st Era: Colonial Period (1607-1840) • 2 million Europeans (90% British), 650,000 Africans • Why/Results
US Immigration Patterns 2nd Era: Later European Migration (1840s-1930s) • 1st Peak (1840s-1850s)—4.3 million (German/Irish) • Stage 2 (Migration transition)—repeatedly… “safety valve” • 2nd Peak (1880s)—German, Irish, Scandinavian • 3rd Peak (1900-1930)—Italy, Russia, Austria-Hungary • 1910—14% of US population was 1st/2nd generation immigrant
US Immigration Patterns 3rd Era: Modern Immigration (1970s to Present) • Asian—1970s-1980s (China, Philippines, India, Vietnam)—7 million • Latin American—1980s-Present (Mexico, Dominican Rep, El Salvador)
Immigration Policies • Quota System • Undocumented Immigration • No one knows how many immigrants are in the US illegally • Mexico • Central America, Asia, Europe • Enter illegally; or “overstay” visas • Inconsistencies…Haiti vs. Cuba • Economic vs. Political migrants (political asylum) California, Texas, and Florida are the leading destinations for undocumented immigrants to the U.S.
36% Luxembourg 19% Switzerland 9% Austria 9% Germany 9% Belgium 6% France 6% Sweden 5% Denmark 4% Netherlands 4% Norway 4% United Kingdom 3% Ireland 2% Spain 2% Italy Immigration Policies Foreign Born as % of European populations
Immigration Policies • Guest Workers— temporarily for employment, not considered permanent migrants • Middle East—wealthy oil states import workers from the Philippines, Sri Lanka, India, Pakistan, and Bangladesh • Foreign workers represent 60 to 90% of labor force in most oil-exporting countries • Time-contract workers— Chinese migrants in Singapore, Malaysia, and Thailand Spanish youths attacked Moroccan immigrants in El Ejido, Spain after an alleged murder.
Internal Migration • Interregional Migration • Spreading westward since colonial times. • Southern shift since the 1980s • Intraregional Migration—migration within a single region • Rural to Urban • Cities to suburbs • 1800, 5% of the US population lived in suburbs • 75% of the US population lives in suburbs • Counterurbanization
Internal Migration The center of U.S. population has consistently moved westward, with the migration of people to the west. It has also begun to move southward with migration to the southern sunbelt.
Net Migration by County, 2000-04 Rural counties in the southwest and Florida have had net in-migration, while there has been net out-migration from rural counties in the Great Plains
Internal Migration • Brazil – migration from the coast to the interior • Indonesia –migration from Java to less populated islands • Russia (Soviet Union) –forced and voluntary migration to the west • India – limits migration • Europe – migrants moving from South to North, looking for better jobs Brasilia was created as Brazil’s new capital In 1960 and since then has attracted Thousands of migrants in search of jobs.
U.S. States as Immigrant Destinations Fig. 3-8: California is the destination of about 25% of all US immigrants; another 25% go to New York and New Jersey. Other important destinations include Florida, Texas, and Illinois.
Emigration from China Fig. 3-10: Various ethnic Chinese peoples have distinct patterns of migration to other Asian countries.
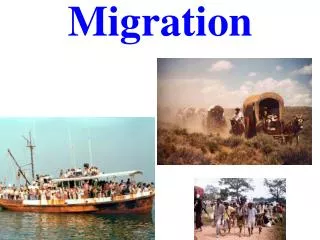
Migration of Vietnamese Boat People Fig. 3-11: Many Vietnamese fled by sea as refugees after the war with the U.S. ended in 1975. Later boat people were often considered economic migrants.
Echo Canyon, northeastern Utah Echo Canyon was one of many obstacles to 19th century wagon trains heading west.
Interregional Migration in the U.S. Fig. 3-13: Average annual migrations between regions in the U.S. in 1995 and in 2003
Intraregional Migration in the U.S. Fig. 3-14: Average annual migration among urban, suburban, and rural areas in the U.S. during the 1990s. The largest flow was from central cities to suburbs.