Download
1 / 21
251 likes | 688 Views
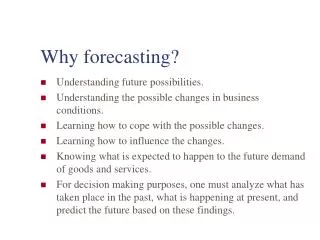
What is Forecasting? A forecast is an estimate of what is likely to happen in the future. Forecasts are concerned with determining what the future will look like; planning is concerned with what it should look like.

E N D
What is Forecasting? • A forecast is an estimate of what is likely to happen in the future. • Forecasts are concerned with determining what the future will look like; planning is concerned with what it should look like. • Forecasting provides a basis for coordinating activities in various parts of the company. • Forecasts are an important input to both long-term, strategic decision-making, as well as for short-term planning for day-to-day operations.
Importance of Forecasting Forecasting is important for all of the functional areas of business: Finance uses long-term forecasts for capital planning and short-term forecasts for budgeting. Marketing produces sales forecasts for market planning and market strategy. Operations develops and uses forecasts for scheduling, inventory management, and long-term capacity planning. Human Resource Management uses forecasts to estimate the need for employees.
Types of Forecasts There are three major types of forecasts: • Demand Forecasts these are estimates of demand for a company’s goods or services. • Technological Forecasts These are forecasts concerned with the rate of change in technology and the impact on a company’s revenues and/or costs. • Economic Forecasts predict inflation rates, employment rates, money supply, housing starts, and other measures of the performance of an economy.
Features of Forecasts All forecasting techniques have the same features: • Forecasting techniques assume that the same basic or original system that existed in the past will exist in the future. • Forecasts are rarely perfect. • Forecast accuracy decreases as the time horizon increases. • Forecastsforgroups of items are more accurate than forecasts for individual items.
Elements of a Good Forecast A properly prepared forecast should meet the following requirements: • The forecast should be accurate. • The forecast should be timely. • The forecast should be reliable. • The forecasting technique should be simple to understand and use. • The forecast should be expressed in meaningful units. • The forecast should be in writing.
Steps in the Forecasting Process There are seven basic steps in the forecasting process: • Determine the purpose of the forecast. • Select the items to be forecast. • Establish a time horizon. • Select the forecasting technique. • Gather and analyze relevant data. • Prepare the forecast. • Monitor the results.
Forecasting Approaches There are two major approaches to forecasting: qualitative (judgmental) and quantitative methods. Further, quantitative methods can be divided into ones that use historical data (time series models) or ones that develop relationships between variables (associative models). Forecasts Based on Judgment Judgmental forecasts rely on analysis of subjective inputs from a variety of sources including customer surveys, sales staff, managers, and panels of experts. Forecasts Based on Time Series Data Some forecasting techniques use historical, or time series data, with the assumption that the future will be like the past.
Forecasts Based on Judgment • Executive Opinion A forecasting method in which the opinions and experience of one or more managers are used to produce a forecast. • Sales Force Opinion Forecasts compiled from estimates of demand made by members of a company’s sales force. • Customer Surveys A forecasting method that seeks input from customers regarding future purchasing plans for existing products or services. • Market Research This method tests hypothesis about new products or services or new markets for existing products or services. • Delphi Method A forecasting technique using a group process that allows experts to make forecasts.
Forecasts Based on Time Series Data • A time series is a sequential series of observations taken at regular intervals over a period of time. • The data may be demand (units or dollars), output (units), profits (dollars), or CPI (indices), among others. • Analysis of time series data seeks to identify the underlying behavior of the series. The underlying behavior is made up of patterns such as: • Trend • Cycles • Seasonality • Random variation
Overview of Time Series Forecasting • A time series consists of a sequential set of data of a variable, such as demand. • There are four possible components of demand: • Trend . A gradual upward or downward movement of the data over time. • Cycles. Wavelike variations in the data that occur every several years. • Seasonality. Short-term, fairly regular variations that are generally related to weather factors or to human-made factors such as holidays. • Random Variations. “Blips “ in the data caused by chance and unusual situations. They follow no discernable pattern, so they cannot be predicted.
Figure 1: Product Demand Charted Over 4 Years with a Growth Trend and Seasonality Trend component Seasonal peaks Average demand over four years Random variation Year 1 Year 2 Year 3 Year 4
Naive Forecasts • A forecast that assumes that demand in the next period will be equal to demand in the most recent period. • Can handle the following components of demand: • Random variation. The last data point becomes the forecast for the next period. • Seasonal variation. The forecast for “this season” is equal to the value of the series “last season”. • Trend. The forecast is equal to the last value of the data series, plus or minus the difference between the last two values.
Techniques for Averaging • These are techniques that are useful for data that has only random variation. • These techniques smooth fluctuations in a time series. • Forecasts that are based on an average are more “stable” than the original data. • There are three popular averaging techniques: • Simple moving average • Weighted moving average • Simple exponential smoothing
Moving Average • A technique that uses a number of historical data values to generate a forecast. • Involves finding a series of successive averages by dropping the first data value in the series and adding the last data value. • Useful for data without trend, seasonality, or cycles.
Simple Moving Average • A key decision involves selecting the number of periods that will be included in the average. • The larger the number of periods, the greater the smoothing; the smaller the number of periods, the quicker the forecast reacts to changes in the data.
Market Mixer, Inc. sells can openers. Monthly sales for an eight-month period were as follows: MonthSalesMonthSales 1 450 5 460 2 425 6 455 3 445 7 430 4 435 8 420 Forecast next month’s sales using a 3-month moving average. Solution: PeriodSalesMoving Average Forecast 1 450 2 425 3 445 4 435 (450 + 425 + 445) / 3 = 440 5 460 (425 + 445 + 435) / 3 = 435 6 455 (445 + 435 + 460) / 3 = 447 7 430 (435 + 460 + 455) / 3 = 450 8 420 (460 + 455 + 430) /3 = 448 9 (455 + 430 + 420) / 3 = Example 1 – Simple Moving Average Illustration Comments: 1. Any forecasts beyond Period 9 will have the same value as the Period 9 forecast; i.e., 435. 2. As a new actual value becomes available, the forecast will be updated by adding the newest value and dropping the oldest one. 3. SMA gives equal weight to all values in the average. Hence, the oldest value has the same weight, or importance, as the newest. 435
Weighted Moving Average • A model that applies different “weights” to each value in the moving average calculation. • Two key decisions: • The number of periods that will be included in the average. The larger the number of periods, the greater the smoothing; the smaller the number of periods, the quicker the forecast reacts to changes in the data. • The weight that will be applied to each period. The higher the weight applied to more recent data, the quicker the model reacts to changes; the lower the weight that is applied to the more recent data, the greater is the smoothing process.
(Let us continue with the same problem as we had in Example 1.) Market Mixer, Inc. sells can openers. Monthly sales for an eight-month period were as follows: MonthSalesMonthSales 1 450 5 460 2 425 6 455 3 445 7 430 4 435 8 420 Forecast next month’s sales using a 3-month weighted moving average, where the weight for the most recent data value is 0.60; the next most recent, 0.30; and the earliest, 0.10. Solution: PeriodSalesWeighted Moving Average Forecast 1 450 2 425 3 445 4 435 (450*.10) + (425*.30) + (445*.60) = 440 5 460 (425*.10) + (445*.30) + (435*.60) = 437 6 455 (445*.10) + (435*.30) + (460*.60) = 451 7 430 (435*.10) + (460*.30) + (445*.60) = 455 8 420 (460*.10) + (455*.30) + (430*.60) = 441 9 (445*.10) + (430*.30) + (420*.60) = Example 2 – Weighted Moving Average Illustration Comments: 1. Any forecasts beyond Period 9 will have the same value as the Period 9 forecast, i.e., 427. 3. WMA gives greater weight to more recent values in the moving average and is more responsive to recent changes in the data. 427
Simple Exponential Smoothing • This is a variation of the weighted moving average model. • Weights are determined by an exponential function which declines as the data gets older. • The formula: Ft+1 = aAt + (1 – a)Ft Where Ft+1 = forecast for next period a = smoothing constant (0 < a < 1) At = current period’s actual demand Ft = current period’s forecast
(Let us continue with the same problem as we had in Example 1.) Market Mixer, Inc. sells can openers. Monthly sales for an eight-month period were as follows: MonthSalesMonthSales 1 450 5 460 2 425 6 455 3 445 7 430 4 435 8 420 Forecast next month’s sales using exponential smoothing with alpha (a) = 0.30 and the first (starting) forecast = 450. Solution: PeriodSalesExponential Smoothing Forecast 1 450450 2 425 (.30*450) + (1 - .30)*450 = 450 3 445 (.30*425) + (1 - .30)*450 = 443 4 435 (.30*445) + (1 - .30)*443 = 443 5 460 (.30*435) + (1 - .30)*443 = 441 6 455 (.30*460) + (1 - .30)*441 = 447 7 430 (.30*455) + (1 - .30)*447 = 449 8 420 (.30*430) + (1 - .30)*449 = 443 9 (.30*420) + (1 - .30)*443 = Example 3 – Simple Exponential Smoothing Illustration Comments: 1. Any forecasts beyond Period 9 will have the same value as the Period 9 forecast, i.e., 436. 3. The higher the value of a, the quicker the reaction to changes in the data and the less the smoothing. 436