Download

1 / 11
110 likes | 250 Views
Whole foods market. Module 4 & 5 Ewa Nelip. Sales growth. Sales growth. Average sales growth for Whole Foods 2010-2013 is 12.8% Average sales growth for the four competitors is 8.84% Both numbers greatly exceed the average growth in the grocery stores industry

E N D
Whole foods market Module 4 & 5 Ewa Nelip
Sales growth • Average sales growth for Whole Foods 2010-2013 is 12.8% • Average sales growth for the four competitors is 8.84% • Both numbers greatly exceed the average growth in the grocery stores industry • Whole Foods’ sales growth is similar to the growth in the organic stores industry • Expected growth in the organic foods industry is 12% • Based on the following information I assume changing growth rates in the future years
Sales growth • Growth in the years 2014-2016 is expected to stay at 10% • Growth will decrease to 8% in 2017-2018 • Long-term growth is expected to be 4% assuming that organic stores industry will become more mature after 2020
Epat and epm calculations • Average EPM for Whole Foods is 3.61% • Industry average EPM is 2.81% • Whole Foods’ higher EPM comes from the higher premium that the store charges
EATO • Average EATO for Whole Foods is 3.83 • Average EATO for the industry is 5.94
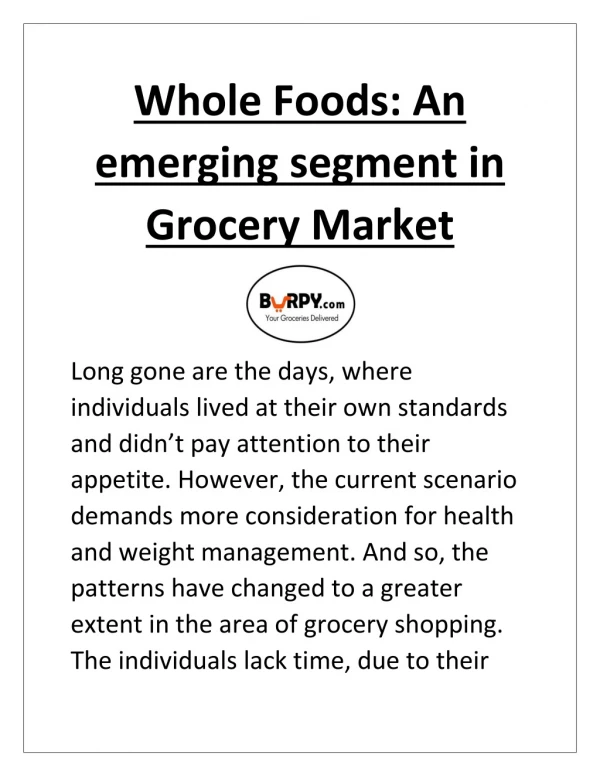
Organic foods industry • $ 63 bn revenue worldwide • $ 31.5 bn revenue in the United States up from $ 1 bn in 1990 • 2002-2011 average growth was 19% per year • 12% expected growth for 2014
Parsimonious assumptions • Enterprise profit margin (EPM) 4.5% • Enterprise asset turnover (EATO) 5 • Changing growth rates
Free cash flow valuation • Due to decreasing growth the cash flow are calculated through 2020 and the terminal value • Long-term growth expected to be 6% (still higher the the growth of the grocery stores industry)