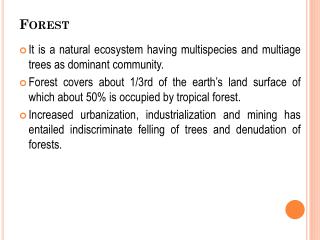
Forest
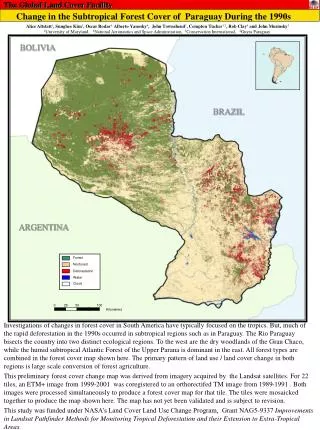
The Global Land Cover Facility. Change in the Subtropical Forest Cover of Paraguay During the 1990s. 0. 25. 50. 100. Kil o me ters. Forest. Nonforest. Deforestation. Water. Cloud.

Forest
E N D
Presentation Transcript
The Global Land Cover Facility Change in the Subtropical Forest Cover of Paraguay During the 1990s 0 25 50 100 Kilometers Forest Nonforest Deforestation Water Cloud Alice Altstatt1, Sunghee Kim1, Oscar Rodas4, Alberto Yanosky4, John Townshend1, Compton Tucker1,2, Rob Clay4 and John Musinsky3 1University of Maryland, 2National Aeronautics and Space Administration, 3Conservation International, 4Guyra Paraguay BOLIVIA BRAZIL ARGENTINA Investigations of changes in forest cover in South America have typically focused on the tropics. But, much of the rapid deforestation in the 1990s occurred in subtropical regions such as in Paraguay. The Rio Paraguay bisects the country into two distinct ecological regions. To the west are the dry woodlands of the Gran Chaco, while the humid subtropical Atlantic Forest of the Upper Parana is dominant in the east. All forest types are combined in the forest cover map shown here. The primary pattern of land use / land cover change in both regions is large scale conversion of forest agriculture. This preliminary forest cover change map was derived from imagery acquired by the Landsat satellites. For 22 tiles, an ETM+ image from 1999-2001 was coregistered to an orthorectifed TM image from 1989-1991 . Both images were processed simultaneously to produce a forest cover map for that tile. The tiles were mosaicked together to produce the map shown here. The map has not yet been validated and is subject to revision. This study was funded under NASA’s Land Cover Land Use Change Program, Grant NAG5-9337 Improvements in Landsat Pathfinder Methods for Monitoring Tropical Deforestation and their Extension to Extra-Tropical Areas.
The Global Land Cover Facility Mosaic of Landsat Imagery for Paraguay 0 25 50 100 Kilometers BOLIVIA BRAZIL ARGENTINA This map of Paraguay was compiled with imagery from the Landsat 4 and Landsat 5 satellites, primarily from 1990. The original images were collected and orthrectified by the Earth Satellite Corporation for the NASA Landsat 1990 global data set. The 1990 global data set were mosaicked together and and are displayed here for Paraguay (bands 7, 4 and 2 as red, green and blue respectively). The 1990 orthorectified data set was the source of the base images for forest cover mapping described on the reverse. For more information about remote sensing data and derived products, please visit the Global Land Cover Facility website (http://glcf.umiacs.umd.edu). The Global Land Cover Facility provides free earth observation imagery and derived data to users around the world. Primary data collections include imagery from the major U.S. earth observation satellites: Landsat (MSS, TM and ETM+) and MODIS data from NASA, and AVHRR and GOES data from NOAA. Derived products focus on land cover classification and analysis, especially forest cover and forest change. GLCF products are available for download at http://glcf.umiacs.umd.edu.