Download
1 / 41
430 likes | 649 Views
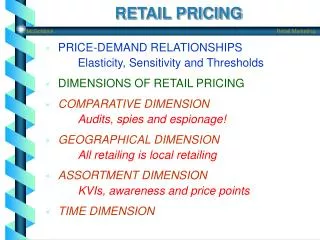
INFORMS Revenue Management & Pricing Section Conference John Quillinan – IBM Global Business Services 25 June 2011. Pricing for Retail Electricity. The dilemma. How do I meet peak energy demand with an aging infrastructure

E N D
INFORMS Revenue Management & Pricing Section Conference John Quillinan – IBM Global Business Services 25 June 2011 Pricing for Retail Electricity
The dilemma How do I meet peak energy demand with • an aging infrastructure • increasing population with larger homes and a greater number of appliances, amidst • rising fossil fuel costs, • pressure to look at renewable fuel sources • environment concerns
One solution is demand management programs such as pricing • As the rate of energy usage increases at 2.3% per year, demand management is one means of dealing with the increasing demands for energy • Using more efficient rate designs or pricing and through interruptible services, demand can be shifted from peak times, thus reducing the need for more power plants • The next frontier for the revenue management and pricing practice will be helping the retail energy providers develop pricing programs, which vary prices at critical peak demand periods and discount prices the rest of the time.
World population is projected to rise to more than 9 billion
Consumer use of plug-in vehicles charged will increase demand
Conserving the environment has become a major social and political issue • Power generation creates forty one percent of worldwide CO2 emissions and is the largest manmade source of CO2 emissions. • Some of the environmental concerns facing energy and utility organizations are • acid rain • visual pollution and site concerns • nuclear waste disposal • decommissioning of nuclear plants • thermal pollution • Greenhouse effect • exposure to electromagnetic fields
World electricity demand will increase by about 87% between 2007 and 2035, or 2.3% per year on average
One thousand seven hundred billion kilowatt hours each year are wasted due to distribution losses
Demand management is a means of dealing with meeting increasing demands for energy • This can be accomplished via shifting demand • through a more efficient rate design, or price-triggered Demand Response program, and • through interruptible services or reliability-triggered Demand Response programs. • In the case of electric utility service, while there is normally only one provider of utility delivery services available, customers do have both short-and long-term choices to make regarding the actual consumption of electricity. • In the short-term, the choices for a residential customer may boil down to a decision to turn the lights off when they leave the house. • In the long-term, for example, the customer might reduce future electricity usage by buying a more efficient appliance when there is a need to replace an old appliance.
Energy usage could be shifted to non-peak periods • With time-differentiated rates, some activities (perhaps hot water heating) could shift to a lower cost period. • A utility customer could decide to move to a smaller or better-insulated facility. • Even greater opportunities for such responses are likely to exist in some portions of the commercial and industrial sectors (where companies have flexibility to alter their usage patterns). • For example, a paper mill might grind pulpwood at low off-peak rates into a storage silo, and thereby still be able to operate the rest of the facility continuously, as required by technological considerations.
Utility rate design has a role to play in guiding customer consumption decisions on an efficient path • Dynamic pricing provides customers a price signal that more accurately reflects actual energy costs during the most critical hours of the year. • Price signals provided by dynamic pricing can lead to reduced electricity use during peak periods when electricity is expensive and increased use during off peak times when it is cheaper—thereby lowering costs for all.
From a rate design perspective, a static (or flat) rate is economically inefficient • When wholesale costs rise above the fixed retail price, the lack of price-responsive demand causes higher resource costs to be incurred than would otherwise be needed • When wholesale costs fall below the fixed price, consumers forgo consumption that they otherwise might use productively at lower prices to expand economic activity
Rate design changes must be made carefully • Utilities can evaluate their rates against five criteria to configure their offerings. • Simplicity & Ease of Understanding • Customer value proposition • Retail-wholesale market connection • Incentive to reduce peak demand • Incentive for permanent load shifting • Let’s review a few of the most popular rates (see if you recognize which one your home is on).
Flat rate versus inclining block rate • About two-thirds of Americans today receive electric service on either flat or declining block rates. • The same rate applies regardless of the time of usage, and total energy consumption • The flat rate is an average cost of energy, and does not send a price signal to the consumer Example • The Inclining Block Rate features an inverted block rate structure, meaning that the customer’s rate progressively increases (in steps) as their consumption within a month increases.
Time-of-Use (TOU) rates, which constitute the most common form of product differentiation in the electric power industry • The TOU rate divides the day into two or more periods, with a different rate for each period. For example, a peak period might a period from 10 am to 6 pm on weekdays, with the remaining hours being considered off-peak. • The rate is higher during the peak period and lower during the off-peak, mirroring the variation in the cost of supplying electricity during those periods. • With the TOU, there is certainty as to what the rates will be and when they will occur. • The TOU rate is not ‘‘dispatchable,’’ and is not technically considered a ‘‘dynamic’’ rate.
Super Peak TOU Rates are similar in concept to basic TOU rates. • A super peak rate applies during a specific period of the day when demand and wholesale prices are the highest • This rate design still includes on peak and off-peak periods as well as super peak period.
Critical Peak Price is a similar concept to TOU with the exception that peak pricing is only applied on a few “event” days • .The utility commonly advertise event days a day in advance, based on a forecast of particularly high demand. • The ratio of on peak to off-peak price is higher for CPP event days than in a TOU program. The same rate structure is applied on every event day. A CPP can be applied on top of a regular TOU rate as shown in the figure to the left.
Rather than charging a higher rate during critical events, the Peak Time Rebate (PTR) gives customers the opportunity to buy through at the existing rate. • The PTR provides a level of bill protection that is not embedded in these other rates. • Because it provides a rebate during critical events but does not increase the rate during other hours, • in the short run a customer’s bill can only decrease under the PTR. However, • Payment of the rebates will result in an increase in the utility’s revenue requirement and, as a result, an increase in the electricity rate in the future.
Participants in Real Time Pricing (RTP) programs pay for energy at a rate with the link to the hourly market price for electricity. Participants are made aware of the hourly prices on either a day-ahead or an hour-ahead basis.
Participants in RTP programs pay for energy at a rate with the link to the hourly market price for electricity. Although RTP offers consumers the greatest potential for economic rewards,, it is often perceived as complicated or risky relative to average cost pricing
AMI is prerequisite for dynamic pricing programs • Outside of pilot programs, fewer than 50,000 residential customers receive service using dynamic pricing tariffs, and they are located in a few states, such as California, Florida and Illinois. • A major reason why dynamic pricing has not been offered to residential customers is the absence of advanced metering infrastructure (AMI), which is a technological prerequisite. • To facilitate pricing structures, electric utilities must install household electricity meters that record usage at least hourly, instead of the traditional mechanical meter that displays cumulative total usage only. These hourly meters are often called “advanced meters”, “interval meters”, or “smart meters”.
If it has not already happened, a smart meter may be coming to your home • Many utilities have conducted pilot projects, installing the meters in a subset of houses and applying time-varying rates, to gauge potential savings associated with demand reductions against installation costs. . • Other economic benefits to the utility of installing advanced meters are the elimination of manual meter reading, and rapid automatic notification of power outages • The American Reinvestment and Recovery Act combined with private investment will put us on pace to deploy more than 40 million smart meters in American homes and businesses over the next few years that will help consumers cut their utility bills
According to DOE EIA, 50% of U.S. households are expected to have a smart meter in 2020. • The Institute for Energy Efficiency estimates that approximately 65 million smart meters will be deployed by 2020, representing 50% of U.S. households.
Does price really elicit a demand response? • So far, we have discussed different rate designs for electricity usage, but the looming question is “Does price really elicit a demand response?”
Is demand for electricity price-elastic? • According to dozens of experiments that have been carried out over the past 30 years, it is, and customers do exhibit a demand response when subjected to dynamic pricing. • The key findings are: • Not every customer will respond • Some will respond marginally • Some will respond a lot • In the aggregate, they do respond quite a bit and their responses persist over time • We also know the demand response to pricing programs will vary.
We also know the demand response to pricing programs will vary Most of the factors contributing to the variability are: • Use of air conditioning • Presence or absence of enabling technology • Climate differences • Weather conditions • Household size • Appliance Stock • Price of substitute fuels
Customers with CAC have a greater ability to reduce consumption . • In California’s statewide pricing pilot, customers with central air-conditioning (CAC) dropped loads by 16%, twice as much as customers without CAC. • The presence of enabling technologies can boost customer response substantially.
Enabling technologies play a role in customer response. • Utilities can offer enabling technology to automate household response to price signals. • A smart thermostat can be programmed to automatically increase cooling set-point temperature during peak hours in response to a CPP event signal from a pager or similar system. • In California’s statewide pricing pilot, customers with smart thermostats dropped loads by almost twice as much as the average residential customer. • Those on gateway systems dropped loads by almost twice as much as customers with smart thermostats, i.e. by about 50%.
Energy Management In Home Display Programmable Thermostat Energy Orb Direct Load Control Here are some examples of enabling technology.
Enabling technologies play a role in customer response. • Across pricing pilots, the percent reduction in peak loads are significantly higher for programs with enabling technology than those program without technology.
Weather conditions have an impact on peak reductions from dynamic pricing. • In an analysis of billing data for 70,000 households in the San Diego region during a five-year period, the nearby weather station’s daily temperature data was matched to the start and end dates for each bill. • Billing-period heating and cooling degree-days, which are highly predictive measures of home heating and cooling energy demand, were used for weather variables. • When measured carefully to account for billing-cycle timing, local weather and geographic effects, the relationship between weather and residential electricity consumption was found to be statistically significant. • Weather conditions and climate difference can be concluded as confounding factors.
Generally, hotter regions tend to experience greater peak reductions. • Dynamic prices were found to have a substantical impact in a hot climate • They had a modest but statistically significant impact even in a mild climate.
Household with high levels of consumption are more responsive to price increases. • Household consumption levels, a possible measure of household size, respond differently. • In an analysis of billing data for 70,000 households in the San Diego region over a five year period, • households using 1000 KWh or more per month, which is typical for a large single family dwelling with air conditioning, on average reduced their consumption by approximately 25%. • In contrast, households that use 200 KWh or less per month, typical of small households (one or two members) residing in apartment, exhibited a zero mean consumption response to the dramatic rise in prices. • Average household consumption fell 13% over a short span of approximately 60 days, in response to an unannounced price increase, and attributed most of the response due to the subset of consumers with high consumption levels.
PRISM is a model for evaluating pricing programs. • Faruqui and Wood (2009) lay out a methodology for quantifying the benefits to customers and utilities of dynamic pricing programs. • A modeling system called The PRISM (Pricing Impact Simulation Model) Suite is the approach employed to assess load response.
PRISM was developed during the California Statewide Pricing Pilot.
PRISM became basis for evaluating the potential of pricing programs in the Federal Energy Regulatory Commission (FERC) Assessment. • PRISM was developed during the California Statewide Pricing Pilot. • The FERC Assessment (2009) predicts that peak demand will increase 15% by 2018 without demand response programs. • It also found that the full-scale deployment of demand response programs, such as dynamic pricing, could reduce U.S. peak demand 14 and 20 percent of peak demand, or 138,000 to 188,000 MW by 2019. • This would eliminate the need for roughly 2,000 peaking power plants.
The challenge for revenue managers and analysts: Which rate designs to recommend, and for each which prices to recommend by customer segment. • Address the 5 criteria (mentioned earlier) • Simplicity & Ease of Understanding • Customer value proposition • Retail-wholesale market connection • Incentive to reduce peak demand • Incentive for permanent load shifting. • Understanding exogenous variables is important to understanding the typical demand response profile, and which customer classes are most likely to respond.. • This would eliminate the need for roughly 2,000 peaking power plants.
Utility needs to make its pricing programs revenue-neutral • If an average customer were to make no behavior changes, they should in theory see no change in their monthly electric bill. . • At the same time, customers who make an effort to minimize electricity consumption during peak periods should see a reduction in their monthly electric bills. • It would not be a good situation if the only customers who opt-in to dynamic pricing programs are the ones who would get lower bills simply by switching over to dynamic pricing rates and not making any reductions in their peak loads.
In conclusion, this is the next frontier for revenue management and pricing professionals. • More efficient energy rate programs are possible with the growing installation of advanced electric meters that measure power consumption hourly - or even more frequently - so that the price can vary according to demand. • Dynamic pricing, in the form of time-of-use rates, critical peak pricing, or real-time pricing, reflects the change in wholesale costs for producing and transmitting electricity during peak hours, when more power plants are in use and the electrical grid is congested. • By offering discounts for off-peak power - and charging a premium for peak power - utilities can reduce the need to build more infrastructure to handle short-duration spikes in consumption, ultimately reducing the overall cost of power.