Download
1 / 29
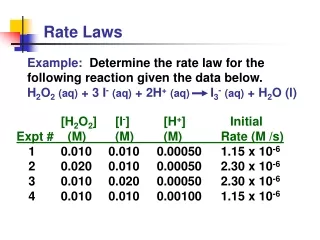
290 likes | 463 Views
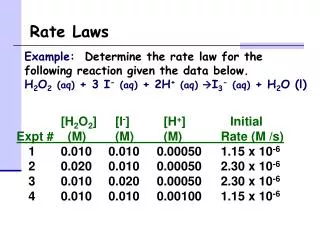
Unit 4-5. Integrated Rate Laws for single reactant rxn. A X +Y + …….. Single reactant, but the product can be one or multiple. Rate = -d[A]/dt A decreases as time goes by. Integrated rate law: It is NOT about the rxn rate.

E N D
Unit 4-5 Integrated Rate Laws for single reactant rxn
A X +Y + …….. • Single reactant, but the product can be one or multiple. • Rate = -d[A]/dt • A decreases as time goes by. • Integrated rate law: It is NOT about the rxn rate. • It is the formula to calculate the amount of A left at certain t (At), after rxn starts. Single reactant rxn
Rate = -d[A]/dt = k • Since rate is constant, d[A] = [A]t – [A]0 dt = t-t0 = t • [A]t = -kt + [A]0 • [A]0 is the initial concentration of A. A is the single reactant in the rxn • [A]t is the concentration of A at some time, t, during the course of the reaction. • Therefore, if a reaction is zero-order, a plot of [A] vs. t will yield a straight line, and the slope of the line will be -k. Integrated Rate Laws : Zero-order rxn
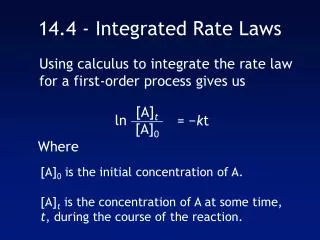
Integrated rate law: First-Order rxns • Rate = -d[A]/dt = k[A] Using calculus to integrate the rate law for a first order process gives us … ln [A]t = −kt + ln [A]0 …which is in the form y = -mx + b Therefore, if a reaction is first-order, a plot of ln [A] vst will yield a straight line, and the slope of the line will be -k.
CH3NC CH3CN First-Order Processes Consider the process in which methyl isonitrile is converted to acetonitrile.
CH3NC (g) CH3CN First-Order Processes This data was collected for this reaction at 198.9°C.
First-Order Processes • When ln P is plotted as a function of time, a straight line results. • Therefore, • The process is first-order. • k is the negative slope: 5.1 10-5 s−1.
1 [A]0 1 [A]t = kt + Integrated rate law : Second-Order rxns Similarly, integrating the rate law for a process that is second-order in reactant A, we get also in the form y = mx + b So if a process is second-order in A, a plot of 1/[A] vs. t will yield a straight line, and the slope of that line is k.
NO2(g) NO (g) + 1/2 O2(g) Second-Order Processes The decomposition of NO2 at 300°C is described by the equation and yields data comparable to this:
Second-Order Processes • Graphing ln [NO2] vs.t yields: • The plot is not a straight line, so the process is not first-order in [A].
Second-Order Processes • Graphing ln 1/[NO2] vs. t, however, gives this plot. • Because this is a straight line, the process is second-order in [A].
Half-Life • Half-life is defined as the time required for one-half of a reactant to react. • Because [A] at t1/2 is one-half of the original [A], [A]t = 0.5 [A]0
0.5 [A]0 [A]0 ln = −kt1/2 0.693 k = t1/2 Half-Life For a first-order process, this becomes ln 0.5 = −kt1/2 NOTE: For a first-order process, the half-life does NOT depend on [A]0.
1 k[A]0 1 [A]0 1 [A]0 1 [A]0 2 [A]0 1 0.5 [A]0 2 − 1 [A]0 = kt1/2 + = kt1/2 + = = kt1/2 = t1/2 Half-Life For a second-order process,
Page551 14.27, 14.29, 14.31,14.35 Homework
The Collision Model • In a chemical reaction, bonds are broken and new bonds are formed. • Molecules can only react if they collide with each other. • Furthermore, molecules must collide with the correct orientation and with enough energy to cause bond breakage and formation.
Activation Energy • In other words, there is a minimum amount of energy required for reaction: the activation energy, Ea. • Just as a ball cannot get over a hill if it does not roll up the hill with enough energy, a reaction cannot occur unless the molecules possess sufficient energy to get over the activation energy barrier.
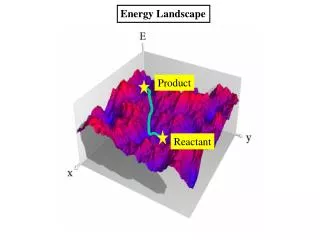
Reaction Coordinate Diagrams It is helpful to visualize energy changes throughout a process on a reaction coordinate diagram like this one for the rearrangement of methyl isonitrile. • Y axis: PE of molecules. X axis: rxn pathway
Reaction Coordinate Diagrams • It shows the energy of the reactants and products (and, therefore, E). • The high point on the diagram is the transition state. • The species present at the transition state is called the activated complex. • The energy gap between the reactants and the activated complex is the activation energy barrier (Ea).
Temperature and Rate • Generally, as temperature increases, so does the reaction rate. • This is because k is temperature dependent.
Maxwell–Boltzmann Distributions • Temperature is defined as a measure of the average kinetic energy of the molecules in a sample. • At any temperature there is a wide distribution of kinetic energies.
Maxwell–Boltzmann Distributions • As the temperature increases, the curve flattens and broadens. • Thus at higher temperatures, a larger population of molecules has higher energy. • The average KE of the molecules also increase with T.
Maxwell–Boltzmann Distributions • If the dotted line represents the activation energy, as the temperature increases, so does the fraction of molecules that can overcome the activation energy barrier. • As a result, the reaction rate increases.
Maxwell–Boltzmann Distributions This fraction of molecules can be found through the expression where R is the gas constant and T is the Kelvin temperature. f = e−Ea/RT
Arrhenius Equation Svante Arrhenius developed a mathematical relationship between k, T and Ea: k = A e−Ea/RT where A is the frequency factor, a number that represents the likelihood that collisions would occur with the proper orientation for reaction.
1 RT Arrhenius Equation Taking the natural logarithm of both sides, the equation becomes ln k = -Ea() + ln A y = mx + b Therefore, if k is determined experimentally at several temperatures, Eacan be calculated from the slope of a plot of ln k vs. 1/T.