Download
1 / 33
330 likes | 343 Views
Explore the factors determining income disparities and growth rates among countries, including economic policies, country characteristics, and the role of luck.

E N D
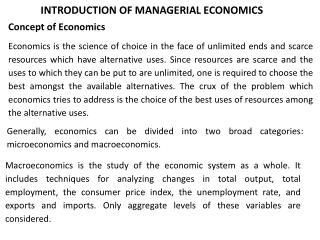
ECONOMICS OF GROWTHINTRODUCTION San Francisco State University| Michael Bar ECON 560, Introduction
Visualization of 200 Years of Growth ECON 560, Introduction
Economic Growth Defined • Economic growth is the growth in real GDPper capita, also known as standard of living. • GDPis the market value of final goods and services produced within the borders of a country (measured in country’s currency). • Realmeans adjusted for inflation. • Per capita means per person (. • For international comparison, we need to use some exchange rate. ECON 560, Introduction
Facts to be Explained Differences in the Levels of Income per Capital Among Countries. That is, why some countries are poor, while others are rich? ECON 560, Introduction
Facts to be Explained Differences in the Rate of Income Growth Among Countries. ECON 560, Introduction
Is the average growth rate a. Increasing, b. decreasing, c. constant ECON 560, Introduction
Math of Growth Rates • Growth rate of : • Variable growing at constant rate g • Log of constant growing variable is linear function of time: ECON 560, Introduction
Math of Growth Rates Important Approximation Rules (for small growth rates): • For small : • Growth of product and ratio: • Rule of 70: ECON 560, Introduction
Is the growth rate in the U.S. real GNP per capita constant since 1900? • From the above figure, which plots the ln(real GNP pre capita) against time, we see that the growth rate in the U.S. is more or less constant (because the ln(real GNP per capita) is a linear function of time). • Also, we can see that the average growth rate is about 2% per year (the slope of the ln(real GNP per capita) is approximately 2%). ECON 560, Introduction
Is the growth rate in the U.S. real GNP per capita constant since 1900? “Their policies produced 1.2% growth, the weakest so-called recovery since the Great Depression, and a doubling of the national debt.” Donald Trump, Detroit, August 08, 2016 ECON 560, Introduction
Growth in U.S. Since Great Recession Growth trend based on pre-recession per year After recession, per year The gap between trend and actual in 2018-Q1 is 21% or $11,146. ECON 560, Introduction
Future of Economic Growth in U.S. “We're looking at a 3 percent, but we think it could be 5, it could even be 6. We're going to have growth that will be tremendous.” Donald Trump, December 29, 2016 ECON 560, Introduction
Small differences in growth rates make big differences in income ECON 560, Introduction
GDP per Capita in the United States, the United Kingdom, and Japan, 1870–2009 Sources: Maddison (1995), Heston, Summers, And Aten (2011). ECON 560, Introduction
The Distribution of Growth Rates, 1975–2009 ECON 560, Introduction Source: Heston, Summers, and Aten (2011).
Figure 1.7 GDP per Capita by Country Group, 1820–2008 Sources: Maddison (2008), Heston, Summers, and Aten (2011). ECON 560, Introduction
World Inequality and Its Components, 1820–1992 Source: Bourguignon and Morrison (2002). ECON 560, Introduction
From the above graph, we see that • All regions grow • The gap between the regions is widening (because of different growth rates). ECON 560, Introduction
Growth before 1820 ECON 560, Introduction
Relatively small differences between the richest and the poorest, before 1820 (factor of 2). ECON 560, Introduction
The case of China • 8th – 12th centuries China is economic and technological leader in the world. • Important inventions: gunpowder, printing, water-powered spinning wheel, use of coal in smelting iron, digging of canals and waterways, world exploration. ECON 560, Introduction
Zheng He (1371–1433) ship vs. Santa Maria (1492) Santa Maria ECON 560, Introduction
Summary of main facts • Before 1820 very little growth and no big differences between countries. • After 1820 unprecedented growth in the world as a whole. • Very unequal distribution of income among countries. • Uneven distribution of growth among countries, widening the gap between the rich and the poor. ECON 560, Introduction
Questions • What factors determine which countries prospered? • Can we point to specific economic policies? • Are there specific country characteristics that determine economic fate? • Is prosperity just a result of luck? ECON 560, Introduction
Our Methodology ECON 560, Introduction
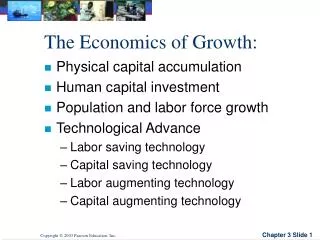
Step 1: Decomposing the cross-country difference in output per worker into differences in inputs and productivity • We use something similar to the next formula: • Where • – output per capita (or per worker) • – capital per worker • – technology level (knowledge how to combine inputs to produce output). • – efficiency (includes effort, institutional bureaucracy, customs, other factors that affect productivity that are not captured by technology). ECON 560, Introduction
Step 2: Why are there differences in capital? • Constructing theory that relates investment and future capital. Main idea: higher saving rate leads to higher investment rate and higher capital per worker. • Learn how to measure “human” capital. ECON 560, Introduction
Step 3: Digging deeper – why are there differences in investment rate, technology, efficiency? • Looking at fundamental (exogenous) cross-country differences such as geography, climate, natural resources, political regimes. ECON 560, Introduction