Download
1 / 22
220 likes | 423 Views
Graphs of a Special Polynomial Function- the Quadratic. Pre-Calculus Day 12. Review Homework Introduction to Polynomials Quadratics (a special polynomial) Homework. Plan for the Day. Analyze graphs of quadratic functions.

E N D
Graphs of a Special Polynomial Function- the Quadratic Pre-Calculus Day 12
Review Homework • Introduction to Polynomials • Quadratics (a special polynomial) • Homework Plan for the Day
Analyze graphs of quadratic functions. • Write quadratic functions in standard form and use the results to sketch graphs of functions. • Find minimum and maximum values of quadratic functions in real-life applications. What You Should Learn
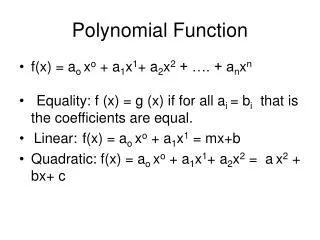
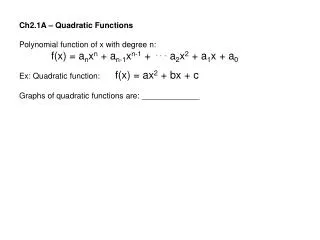
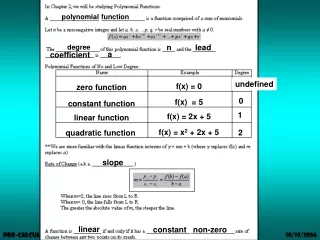
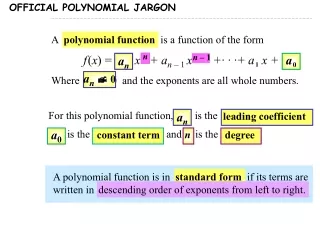
A polynomial functionis a function of the form where n is a nonnegative integer and a1, a2, a3, …an are real numbers. The polynomial function has a leading coefficient anand degreen. Polynomial Function
y y y f(x) = x3 – 5x2+4x + 4 x x x Graphs of polynomial functions are continuous. That is, they have no breaks, holes, or gaps. continuous not continuous continuous smooth not smooth polynomial not polynomial not polynomial Graphs of Polynomial Functions Polynomial functions are also smooth with rounded turns. Graphs with points or cusps are not graphs of polynomial functions.
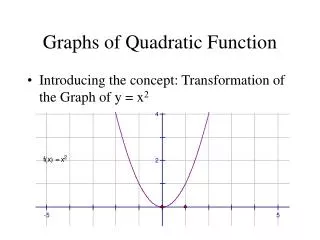
In this section, you will study the graphs of polynomial functions. You have been introduced to the following basic functions. f(x) = ax + b f(x) = c f(x) = x2 These functions are examples of polynomial functions. Linear function Constant function Squaring function or Quadratic function Polynomial Functions
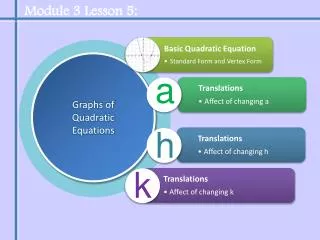
Each of the following functions is a quadratic function in different forms f(x) = x2 + 6x + 2 g(x) = 2(x + 1)2 – 3 h(x)= 9 + x2 k(x) = –3x2 + 4 m(x)= (x – 2)(x + 1) The graph of any quadratic function is a parabola. The Graph of a Quadratic Function
Finding key points – what would they be? Sketching a graph based upon translation from the parent graph y = x2 . Moving from one format to another to help find key points. What is the method to move from standard form to graphing form? Analyzing a Quadratic Equation
Which format would be useful to do what??? f (x) = x2 + 6x + 2 g(x) = 2(x + 1)2 – 3 m(x) = (x – 2)(x + 1) Analyzing a Quadratic Equation
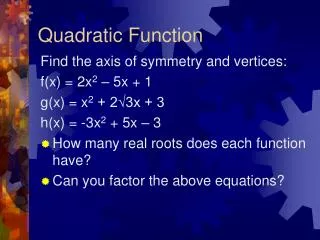
All parabolas are symmetric with respect to a line called the axis of symmetry, or simply the axis of the parabola. The point where the axis intersects the parabola is the vertex of the parabola. The Graph of a Quadratic Function Leading coefficient is negative. Leading coefficient is positive.
y x vertex minimum y x vertex maximum The leading coefficient of ax2 + bx + c is a. a > 0 opens upward When the leading coefficientis positive, the parabola opens upward and the vertex is a minimum. f(x) = ax2 + bx + c When the leading coefficient is negative, the parabola opens downwardand the vertex is a maximum. f(x) = ax2 + bx + c Leading Coefficient a < 0 opens downward
Example: Compare the graphs of , and The simplest quadratic functions are of the form f(x) = ax2 (a 0) These are most easily graphed by comparing them with the graph ofy = x2. y 5 Simple Quadratic Functions x -5 5
y 4 (3, 2) vertex x -4 4 Example: Graph f(x) = (x –3)2 + 2 and find the vertex and axis. f(x) = (x –3)2 + 2is the same shape as the graph of g(x) = (x –3)2 shifted upwards two units. g(x) = (x–3)2 is the same shape as y = x2 shifted to the right three units. f(x) = (x –3)2 + 2 g(x) = (x –3)2 y = x2 Example: f(x) = (x –3)2 + 2
The graphing form for the equation of a quadratic function is:f(x) = a(x – h)2+ k (a 0) The graph is a parabola opening upward if a 0 and opening downward if a 0. The axis is x = h, and the vertex is (h, k). y x (–1, –3) x = –1 Example: Graph the parabola f(x) = 2x2 + 4x – 1 and find the axis and vertex. f(x) = 2x2 + 4x – 1 f(x) = 2x2 + 4x – 1 original equation f(x) = 2(x2 + 2x) – 1 factor out 2 f(x) = 2(x2 + 2x + 1) – 1 – 2complete the square f(x) = 2(x + 1)2 – 3 standard form Quadratic Function in Standard Form a > 0parabola opens upward like y = 2x2. h = –1, k = –3 axis x = –1, vertex (–1, –3).
y (3, 16) 4 (–1, 0) (7, 0) x 4 x = 3 Example: Graph and find the vertex and x-intercepts of f(x) = –x2 +6x + 7. f(x) = –x2 + 6x + 7 original equation f(x) = –(x2 – 6x) + 7 factor out –1 f(x) = –(x2 – 6x + 9) + 7 + 9 complete the square f(x) = –(x – 3)2 + 16 standard form a< 0parabola opens downward. h = 3,k = 16axis x = 3, vertex (3, 16). Find the x-intercepts by solving–x2 + 6x + 7 = 0. (–x + 7 )(x + 1) = 0 factor Vertex and x-Intercepts x = 7, x = –1 x-intercepts (7, 0), (–1, 0) f(x) = –x2 +6x + 7
y (0, 1) x (2, –1) 1 = 4a –1 and Since (0, 1) is a point on the parabola: f(0) = a(0–2)2 – 1 Example: Find an equation for the parabola with vertex (2, –1) passing through the point (0, 1). y = f(x) f(x) = a(x – h)2 + kstandard form f(x) = a(x –2)2 + (–1)vertex (2, –1) = (h, k) Example: Parabola
Do you remember… Averaging the intercepts… The resulting formula… Think about the quadratic formula… Another Method for finding the vertex
The vertex of the graph of f(x) = ax2 + bx + c (a0) At the vertex, Vertex of a Parabola Example: Find the vertex of the graph of f(x) = x2 – 10x + 22. f(x) = x2 – 10x + 22 original equation a = 1, b = –10, c = 22 Vertex of a Parabola So, the vertex is (5, -3).
At the vertex, Example: A basketball is thrown from the free throw line from a height of six feet. What is the maximum height of the ball if the path of the ball is: The path is a parabola opening downward. The maximum height occurs at the vertex. Example: Basketball So, the vertex is (9, 15). The maximum height of the ball is 15 feet.
I have a new puppy named Pickle. I want to build a fence behind my house to keep Pickle safe. I have 60 feet of fencing and I will be using the back of the house for one side (the house is 50 feet long). Using your graphing calculator answer the following: Using all the fencing, what would be the dimensions of the fence if I want Pickle to have 400 square feet of space? What would be the dimensions for the largest possible space for Pickle? Another Example
Analyze graphs of quadratic functions. • Write quadratic functions in standard form and use the results to sketch graphs of functions. • Find minimum and maximum values of quadratic functions in real-life applications. What You Should Learn
Section 2.1 Page 116 • 1-8 all (matching) • 29-33 (odd) algebraic and graphing calculator • 37-45 (odd) • 77, 79, 83 Quiz next class – radicals Homework 7