Download
1 / 24
240 likes | 353 Views
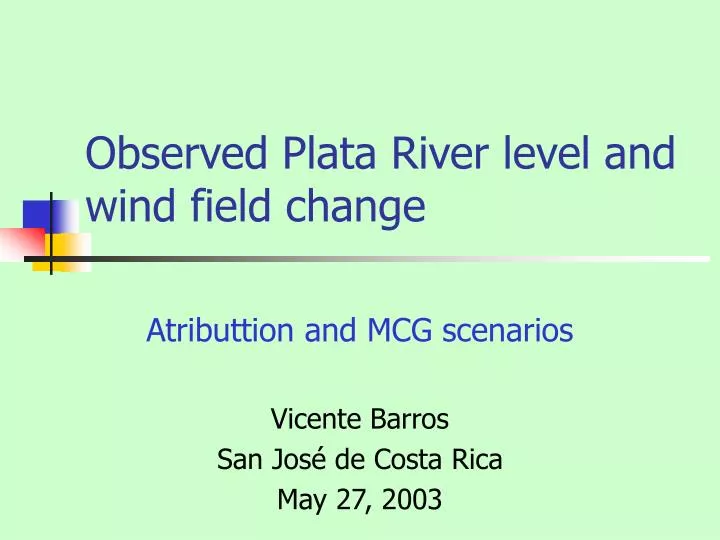
Observed Plata R iver level and wind field change. Atributtion and MCG scenarios Vicente Barros San José de Costa Rica May 27, 2003. Area of concern. MEAN LEVEL. at Buenos Aires Port: 1.7 0.1 mm/año (D’Onofrio, SHN). Seasonal trends of River level at Buenos Aires port (1912-2001).

E N D
Observed Plata River level and wind field change Atributtion and MCG scenarios Vicente Barros San José de Costa Rica May 27, 2003
MEAN LEVEL at Buenos Aires Port: 1.7 0.1 mm/año (D’Onofrio, SHN)
Seasonal trends of River level at Buenos Aires port (1912-2001) SUMMER AUITUMN SPRING WINTER Fuente: D’Onofrio y Fiore (2002)
Observed changes in sea level pressure and wind fields 1951-1960 1991-2000 A A
Figure 2. Annual mean position of the maximum sea level pressure on the South American coast derived from the NCEP reanalyses and station data
Atributtion of the southward shift of the western border of the South Atlantic high
Validation of GCM experiments: Sea level pressure NCEP (observed) (1950-2000) HADCM3 (1950-2000) Campos medios anuales
Climate model validation: sea level pressure The models that best represent the mean sea level pressure and its seasonal variability are: HADCM3 CSIRO-Mk2 ECHAM4 GFDL-R30
Figure 6: Model 1 (upper panel) y Model 2 (bottom panel) of HADCM3, CSIRO and GFDL GCM models.
Time series of factor loadings related to GCM models.
GCMs, only driven by GHGs and aerosol concentration trends, show the same trend as the observed SLP field
Further evidences: Future scenarios
Sea level pressure fields: ECHAM4 experiment 1990-2000 2050-2099 Campos medios anuales