Download
1 / 27
270 likes | 412 Views
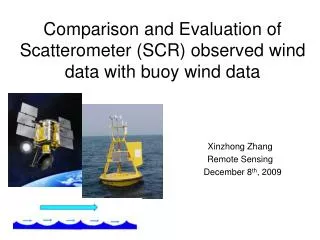
Comparison and Evaluation of Scatterometer (SCR) observed wind data with buoy wind data. Xinzhong Zhang Remote Sensing December 8 th , 2009. Outline.

E N D
Comparison and Evaluation of Scatterometer (SCR) observed wind data with buoy wind data Xinzhong Zhang Remote Sensing December 8th, 2009
Outline • Abstract • Introduction • SCR observation issues • Data Processing & Results • Future work
Abstract Seawinds scatterometer (SCR) wind data on QuikSCAT are compared with buoy observed wind data in this study. Based on this comparison, we can evaluate the accuracy and reliability of SCR wind data. Furthermore, factors like SST, ocean current, rain effect etc., which could probably affect the SCR wind data accuracy are briefly reviewed.
Introduction • Why is this kind of comparison important? • How does SCR wind observation work? • How does buoy-based wind observation work? • Potential factors to influence scatterometer wind data. • Data description (SCR data & Buoy wind data).
Why is this important? • Increasing “popularity” of SCR wind data • Errors INDEED exist within those SCR wind data • Calibration is needed to improve SCR wind data accuracy
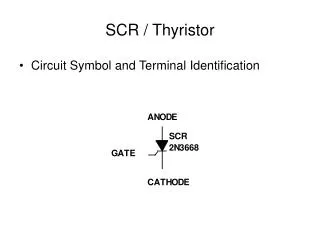
How does SCR wind observation work? • Bragg scattering • EMPIRICAL model function to relate backscatter cross section to Relative wind velocity
How does buoy-based wind observation work? Anemometer • Anemometer installed at the top • Wind speed and direction are averaged over periods of 8 or 10 minutes
12 m 10 m 6 m 3 m < 2 m
Potential factors to influence SCR wind data. • SST (Liu, W. T., 1984) • Air-sea temperature difference • Atmospheric density stratificaiton (Liu, 1984; Wu, 1991) • Underneath ocean currents (Kelly et al., 2001) • Rain (Weissman et al.,2002)
Data description Seawinds data on QuikScat (ftp://ftp.ssmi.com/qscat/qscat_wind_vectors/): • Original Orbit Wind Vector Data (swath data), which are not averaged spatially between ascending and descending swaths. • Each orbit has one set of data, where those data are gridded into wind vector cells, 76(cross orbit) * 1624 (along orbit) Buoy wind data (http://www.ndbc.noaa.gov/): • Continuous wind data (10 minutes period’s average) • 10 minutes’ time interval • Original wind data at the height of buoy anemometer, which need to be converted in to standardized height (10m) in order to be comparable to the satellite wind data (wind at 10m height)
Satellite observed RELATIVE velocity (wind relative to the sea surface) • Ocean current effect to the QuikScat observed wind: (Xu, Y., R. B. Scott. 2008)
Rain effect to the QuikScat observed wind: (Weissman, et al. 2001).
SST effect (Left figure) and Atmospheric stability effect (Right figure) to the QScat observed wind: (Liu, W. T., 1984)
1. Select buoy station 44009, located right outside of the Delaware Bay. #44009 Anemometer height: 5 m above site elevation Fortunate thing: Its distance away from the coast is >25 km.
2. Choose time periods of interest. Here in this study, the periods of Jan. 1st-10th, Apr. 1st-10th, Jul. 1st-10th, Oct. 1st-10th from 2005, 2006, 2007, 2008 years are chosen, so that both available satellite data and buoy data could be compared within those chosen periods.
3. Choose collocation time and distance ranges for QuikScat observation and buoy observation Buoy location QuikScat wind cells closest to the buoy locations within 25 km and buoy observations closer to the QuikScat winds within 30 minutes are chosen. 25km 4. Convert buoy wind data to the equivalent neutral wind speed at the standardized height (10m), using the method of Liu and Tang (1996). Satellite Swath Wind at 10m Wind at 5m
Results For all collocated data available (193 data points)
Results For all collocated data available (193 data points)
Results POOR!! For 4 years averaged data Should be due to the inappropriate processing method
Future work Find out: Does the sign (+ OR -) of the difference give any information about the ocean current below the surface wind? Need Current data to verify!
Future work Choose more interesting buoys and compare again….
Reference • Dickinson, S., K.A. Kelly, M.J. Caruso, and M.J. McPhaden (2001): A note on comparisons between TAO buoy and NASA scatterometer wind vectors. J. Atmos. Oceanic Tech., 18, 799–806. • Freilich, M. H., and R. S. Dunbar (1999), The accuracy of the NSCAT 1 vector winds: Comparisons with National Data Buoy Center buoys, J. Geophys. Res., 104(C5), 11,231–11,246. • Xu, Y., R. B. Scott. Subtleties in forcing eddy resolving ocean models with satellite wind data. Ocean Modelling 20 (2008) 240–251 • Liu, W.T., Tang, W., 1996. Equivalent neutral wind, JPL Publication 96-17, Jet Propulsion Laboratory, Pasadena, 16 pp. • LIU, W. T., 1984, The effects of the variations in sea surface temperature and atmospheric stability in the estimation of average wind speed by SEASAT-SASS, J. Phys. Oceanogr., 14, 392 –401. • Satheesan, K. Sarkar, A. Parekh, A. Kumar, M. R. Kuroda, Y., Comparison of wind data from QuikSCAT and buoys in the Indian Ocean. International Journal of Remote Sensing. 2007, VOL 28; Vol 10, pages 2375-2382 • Weissman, D. E., M. A. Bourassa, and J. Tongue, Effects of rain-rate and wind magnitude on SeaWinds scatterometer wind speed errors, J. Atmos. Oceanic Technol., submitted,2001.