Download
1 / 22
220 likes | 304 Views
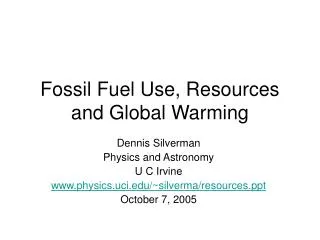
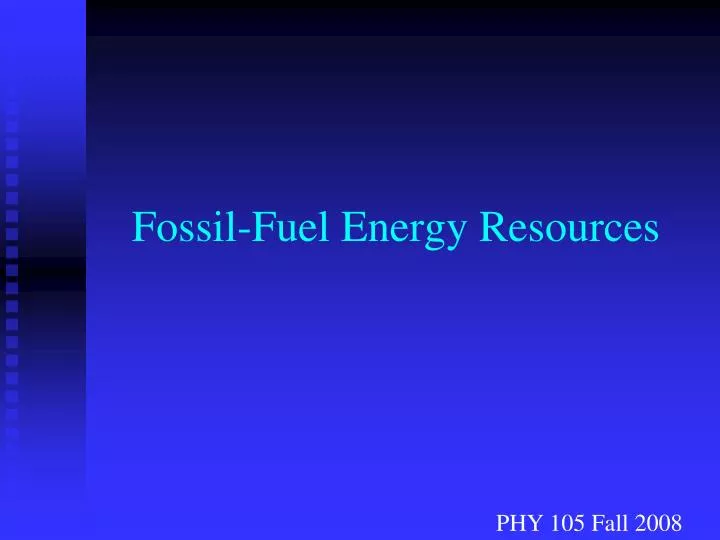
Fossil-Fuel Energy Resources. PHY 105 Fall 2008. Human Population. Human Population. Total. ~400 Quadrillion Btu. Coal. Geothermal, wind, solar, etc. Gas. Biomass. RE. Nuclear. Hydro. Oil. World Energy Use. World: ~84 million barrels/day; US: ~21 million barrels/day.

E N D
Fossil-Fuel Energy Resources PHY 105 Fall 2008
Total ~400 Quadrillion Btu Coal Geothermal, wind, solar, etc. Gas Biomass RE Nuclear Hydro Oil World Energy Use World: ~84 million barrels/day; US: ~21 million barrels/day
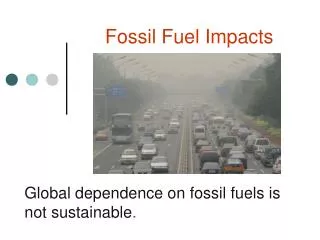
Peak models – world production USGS (BP + 50%) BP reserves
Recent World Oil Production Thousand barrels per day Thousand barrels per day
Natural Gas National Petroleum Council (1998) US Prod. Import from Canada 1998 19 Tcf 3.0 Tcf 2005 22.6 Tcf 3.7 Tcf 2010 25.1 Tcf 3.8 Tcf 2015 26.6 Tcf 4.3 Tcf Canada produced 6.6 Tcf in 2002 and is flat or decreasing slowly, with increasing domestic demand. Now the numbers are more like … 1998 19.0 Tcf 2001 19.6 Tcf 2003 19.1 Tcf 2006 18.5 Tcf “Natural Gas: Meeting the Challenge of the Nation’s Growing Natural Gas Demand” National Petroleum Council 1999 http://www.npc.org
Reserves/Production for Coal (years left) • In the U.S. • 1939, best estimate: 3800 years • 1953, best estimate: 1900 years • 1993, best estimate: 300 years • 2007, best estimate: 234 years World reserves (BP estimates): 1993 - 250 years 2005 – 155 years 2007 – 133 years 3% growth – 60 years
Tar Sands Alberta, Canada Effectively a mining operation Current production of >106 b/d of synthetic crude oil Estimate ~3×10⁶b/d in 10 yrs., 5×10⁶ b/d in 25 yrs. Needs large amounts of NG and water EROEI is perhaps 2:1 – 3:1 Cost ~$25/bbl (existing), $50/bbl (new projects)
Oil Shale Western U.S. Possibly 800 billion barrels !! A mined product Techniques proven in principle, but not large scale Only profitable with oil >$75/bbl High growth, optimum scenario – 106 bpd in 2025 EROEI is (optimistically?) estimated at ~2:1 – 4:1 Rand Corp. report for US DOE, Nat’l. Energy Tech. Lab.
Wind Tar sands Hydro “Net energy from the extraction of oil and gas in the United States” Cutler J. Cleveland Energy30 (2005) 769–782 EROEI
Options?? • Tar sands • Shale oil • Hydrogen • Ethanol • Decreased consumption • Environ. + production problems • Environ. + production problems • Currently uses NG; see above • Corn – land, net energy probs. • Sign of personal virtue
Solar Energy Resource Worldwide energy reserves Yearly insolation NG Oil Coal World energy use per year U