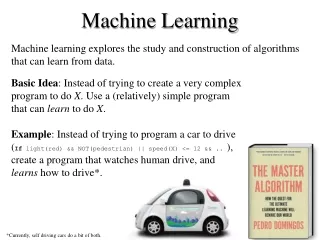

CSCE883 Machine Learning
E N D
Presentation Transcript
CSCE883 Machine Learning Lecture 6 Spring 2010 Dr. Jianjun Hu
Outline • The EM Algorithm and Derivation • EM Clustering as a special case of Mixture Modeling • EM for Mixture Estimations • Hierarchical Clustering
Introduction • In the last class the K-means algorithm for clustering was introduced. • The two steps of K-means: assignment and update appear frequently in data mining tasks. • In fact a whole framework under the title “EM Algorithm” where EM stands for Expectation and Maximization is now a standard part of the data mining toolkit
Missing Data • We think of clustering as a problem of estimating missing data. • The missing data are the cluster labels. • Clustering is only one example of a missing data problem. Several other problems can be formulated as missing data problems.
Missing Data Problem (in clustering) • Let D = {x(1),x(2),…x(n)} be a set of n observations. • Let H = {z(1),z(2),..z(n)} be a set of n values of a hidden variable Z. • z(i) corresponds to x(i) • Assume Z is discrete.
EM Algorithm • The log-likelihood of the observed data is • Not only do we have to estimate but also H • Let Q(H) be the probability distribution on the missing data.
EM Algorithm • The EM Algorithm alternates between maximizing F with respect to Q (theta fixed) and then maximizing F with respect to theta (Q fixed).
Example: EM-Clustering • Given a set of data points in R2 • Assume underlying distribution is mixture of Gaussians • Goal: estimate the parameters of each gaussian distribution • Ѳ is the parameter, we consider it consists of means and variances, k is the number of Gaussian model. We use EM algorithm to solve this (clustering) problem EM clustering usually applies K-means algorithm first to estimate initial parameters of
Steps of EM algorithm(1) • randomly pick values for Ѳk (mean and variance) ( or from K-means) • for each xn, associate it with a responsibility value r • rn,k - how likely the nth point comes from/belongs to the kth mixture • how to find r? Assume data come fromthese two distributions
Steps of EM algorithm(2) Distribution by Ѳk Probability that we observe xn in the data set provided it comes from kth mixture Distance between xn and center of kth mixture
Steps of EM algorithm(3) • each data point now associate with (rn,1, rn,2,…, rn,k)rn,k – how likely they belong to kth mixture, 0<r<1 • using r, compute weighted mean and variance for each gaussian model • We get new Ѳ, set it as the new parameter and iterate the process (find new r -> new Ѳ -> ……) • Consist of expectation step and maximization step
EM Ideas and Intuition • given a set of incomplete (observed) data • assume observed data come from a specific model • formulate some parameters for that model, use this to guess the missing value/data (expectation step) • from the missing data and observed data, find the most likely parameters (maximization step) MLE • iterate step 2,3 and converge
MLE for Mixture Distributions • When we proceed to calculate the MLE for a mixture, the presence of the sum of the distributions prevents a “neat” factorization using the log function. • A completely new rethink is required to estimate the parameter. • The new rethink also provides a solution to the clustering problem.
MLE Examples Suppose the following are marks in a course 55.5, 67, 87, 48, 63 Marks typically follow a Normal distribution whose density function is Now, we want to find the best , such that
EM in Gaussian Mixtures Estimation: Examples • Suppose we have data about heights of people (in cm) • 185,140,134,150,170 • Heights follow a normal (log normal) distribution but men on average are taller than women. This suggests a mixture of two distributions
zti = 1 if xt belongs to Gi, 0 otherwise (labels r ti of supervised learning); assume p(x|Gi)~N(μi,∑i) E-step: M-step: EM in Gaussian Mixtures Estimation Use estimated labels in place of unknown labels
EM and K-means • Notice the similarity between EM for Normal mixtures and K-means. • The expectation step is the assignment. • The maximization step is the update of centers.
Cluster based on similarities/distances Distance measure between instances xr and xs Minkowski (Lp) (Euclidean for p = 2) City-block distance Hierarchical Clustering
Start with N groups each with one instance and merge two closest groups at each iteration Distance between two groups Gi and Gj: Single-link: Complete-link: Average-link, centroid Agglomerative Clustering
Example: Single-Link Clustering Dendrogram
Choosing k • Defined by the application, e.g., image quantization • Plot data (after PCA) and check for clusters • Incremental (leader-cluster) algorithm: Add one at a time until “elbow” (reconstruction error/log likelihood/intergroup distances) • Manual check for meaning