Download
1 / 9
90 likes | 110 Views
Analyzing Polynomial Functions. Objectives 2i and 2k. OBJECTIVES. 2i Determine the solutions to quadratic equations by using graphing, tables, completing the square, the quadratic formula, and to include real-life applications. (DOK 1)

E N D
Analyzing Polynomial Functions • Objectives 2i and 2k
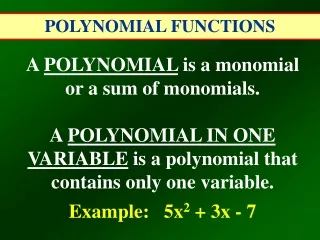
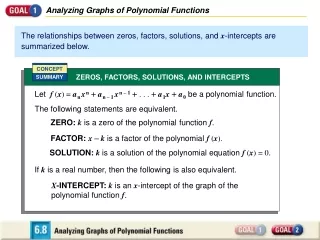
OBJECTIVES • 2i Determine the solutions to quadratic equations by using graphing, tables, completing the square, the quadratic formula, and to include real-life applications. (DOK 1) • 2k Graph and analyze quadratic functions to include relating x intercepts to solutions and real-life applications.
Kangaroo Jump • The height of a kangaroo can be modeled by the quadratic function: • h(t) = -16t2 + 24t • where h is the height in feet the kangaroo jumps at a given time t in seconds. • What is the dependent variable? • What is the independent variable?
h(t) = -16t2 + 24t • What are the x-intercepts and what information do they provide? • What is the y-intercept and what information does it provide? • What is the vertex and what information does it provide? • What is the range of the function? • What is the domain of the function ?
Projectiles • A projectile is fired vertically upward from a point above the ground, modeled by the function h(t) = -16t2 + 76t + 20, where t is measured in seconds and h is measured in feet.
h(t) = -16t2 + 803t + 600 • What is the x-intercept and what information does it provide? • What is the y-intercept and what information does it provide? • What is the vertex and what information does it provide? • Domain & Range ?
Population Growth • The population growth of a certain species of bacteria can be modeled by a quadratic function, • P(t) = 0.5t2 -7t + 50 • where t the time measured in minutes and p is the population measured in hundreds. • During the first few minutes of observation, the population decreases, but then begins to increase again over time. • Interpret what the ordered pair (2, 38) means for this model.
P(t) = 0.5t2 -7t + 50 • What is the x-intercept and what information does it provide? • What is the y-intercept and what information does it provide? • What is the vertex and what information does it provide? • If the bacteria growth was observed for 20 minutes, what was the initial population and what was the ending population? • Domain & Range and what do they mean ?
Application Poster Lab • ***Ms.Coon