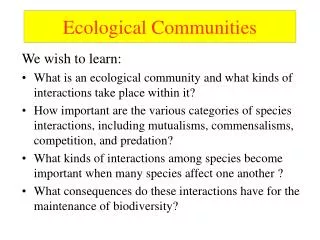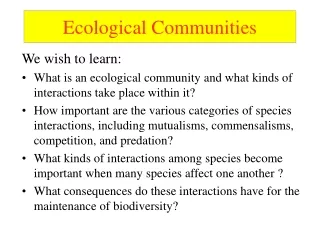
Ecological communities
Ecological communities. Community. Guild. Assembly. A community is a local assembly of species that potentially interact. Generally these species are on the same trophic level . A community of species with similar niches is called an ecological guild. Counter examples

Ecological communities
E N D
Presentation Transcript
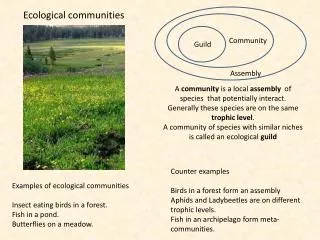
Ecological communities Community Guild Assembly A community is a local assembly of species that potentially interact. Generally these species are on the same trophic level. A community of species with similar niches is called an ecological guild Counter examples Birds in a forest form an assembly Aphids and Ladybeetles are on different trophic levels. Fish in an archipelago form meta-communities. Examples of ecological communities Insect eating birds in a forest. Fish in a pond. Butterflies on a meadow.
Examples of communities Plant visitors and pollinators Nepenthes pitcher plants Deep sea bacterial communities Calcareous grassland
Mutual effects of species interections: Direct effects refer to the impact of the presence (or change in abundance) of species A on species B in a two-species interaction. Indirect effects refer to the impact of the presence (or change in abundance) of species A on species C via an intermediary species (A --> B --> C). Cascading effects are those which extend across three or more trophic levels, and can be top-down (predator --> herbivore --> plant) or (plant --> herbivore --> predator). Keystone species are those which produce strong indirect effects. Kelp (brown algae) forest _ _ _ _ + The starfish Pisaster predates on Mytilus mussels and makes space for many other species to colonise. The top predator Pistasteris a keystone species. Fisherig Sea otter (Enhydra) Sea urchin (Echinus)
Abioticand isolationfiltersatdifferentspatialscalesdeterminelocalspeciescomposition Global speciespool Abioticfilters Abioticfilters Isolationfilter Localspeciespools Community Regionalspeciespools Abioticfilters Members of single communities pass thesefilters.
The distribution of species abundances Rank – abundance plot Relative abundances in a sequence of plant succession (Bazzaz 1975) In natural comunities species abundances often differ by factors of more than 1000. That means that the most abundant species are 1000 times more abundant than the rare species
Three types of relative abundance distributions (SAD) Log-series SAD Power function SAD Log abundance Log abundance Ronald A. Fisher (1890-1962) Heavy tail P(N) is the probabiity that a species has exctly N individuals Species rank order i Species rank order i Log-normal SAD Log abundance Robert May of Oxford(1938-) Frank W. Preston (1896-1989) Species rank order i
Power function SAD Parasitic Hymenoptera in a beech forest Heavy tail Log abundance Species rank order i • Power function SADs • have a high number of rare species (heavy tail) • are input (colonization) drivenhave a high degree of species turnover • often characterize species assemblages but not true communitieshave a small number of very abundant species • lack a larger number of intermediate abundant species • Examples • Incomplete samples • Arthropod assemblages • Disturbed habitats
Northern German Grassland spiders (Finch 2001) Log-series SAD Log abundance Species rank order i • The log series is a sample distribution. It describes the expected abundance of species in a sample from a large community. It applies to assemblages. • For fully censused assemblages it occurs most often • at early stages of succession • in disturbed habitats • inheterogeneous assemblages • Examples • Incomplete samples • Heterogeneous assemblages • Largearthropodsamples
Beetles in a Norwegian spruce forest (Ottesen 1996) Log-normal SAD High number of species with intermediate abundance Log abundance Species rank order i Lognormal SADs are derived from the central limit theorem of statisticsthatpredictnormaldistributions Breeding birds of Ohio (Hicks 1935) • Lognormaldistributions occur most often in • closed and stable communities • undisturbed habitats • K- species dominated communities • Communities influenced by a large number of divergent environmental factors. veil line Often the distribution is not symmetrical having an excess of rare species.
Diversity and evennness A measure of diversity is the number of species High evenness Simpson index of diversity Shannon index of diversity Abundance Log-series index of diversity Species Lower evenness Diversity indices are measures of encounter probability Abundance Evenness Species
Alpha, beta and gamma diversity Alpha diversity refers to the local number of species Beta diversity refers to the change in species composition among local habitats Gamma diversity refers to the regional species pool Multiplicative partitioning of diversity Additive partitioning of diversity g b Species richness a Area Beta diversity is a measure of regional habitat diversity
Species interactions or neutrality Pool of individuals Motoo Kimura (1924-1994) Stephen P. Hubbell (1942- Mutations Randommigration Birth Death Individualsaregrouped to evolutionarylineages Speciesareecologicallyequivalent Neutral models are individual based! Ecological drift Zero sum multinomial J is the totalnumber of individuals Neutral models lack any specific biological interaction like competition, mutualism, regulation, species specific survival. Neutralmodelsprovideecologicalexpectationswithoutspeciesinteraction
10000 Core species 1000 100 Abundance 10 1 0 5 10 15 20 25 30 Rank order 100 Satellite species 10 Abundance 1 0.1 0 5 10 15 20 25 30 Rank order Neutral models make explicit predictions about Abundancerank order relationships Diversity and evenness Leistus rufomarginatusPhotos by Roy Anderson Groundbeetles on lake islands in Lake Mamry(Ulrich and Zalewski 2007)
35 30 25 20 Species 15 10 5 0 1 2 4 8 15 Sites occupied Neutral models make explicit predictions about Core and satellite species Predicted Observed Dyschirius globosus Regional diversity patterns Ground beetles on lake islands in Lake Mamry (Ulrich and Zalewski 2007) Observed Predicted
Ecological gradients and the classification of communities Ground beetles from Mazuran lake lands Distance matrix The first two eigenvectors Principal component analysis
Principal component analysis PCA serves to identifyecologicalcommunities
Communities as ecologicalindicators Ecological indicators are used to provideinformation about the state and the functioning of ecologicalsystems. Indicatorsmight be single species , sets of speciesorwholecommunities. Oftenusedindicators