Download
1 / 34
340 likes | 369 Views
Invest in the Global Health and Biotechnology Fund for defensive earnings and a hedge against future liabilities. Explore the exceptional long-term growth opportunities in the medicine and biotechnology sectors driven by ageing populations and advancements in drug discovery technologies. Learn how biotechnology companies are capitalizing on the exploding growth phase with proven medical benefits and strong financial performance.

E N D
Global Health and Biotechnology Fund David Asplin June, 2001
Superior long term capital growth Defensive earnings Hedge against future liabilities Why invest in Health?
Ageing Populations Medicine - a healthy investment prospect Exceptional long-term growth Biotechnology revolution
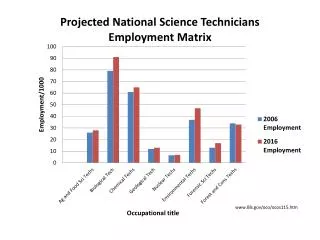
Elderly on the increase Number of people aged over 65 in US (m) Source: US Census Bureau
Sales growth driven by volume demand, not price Source: IMS, Pharmaceutical Pricing Index Update
Drugs save costs: ulcer treatment Only option Not available First ulcer drug invented Antibiotics combination treatment $140 Annual Costs per Patient Surgery Drugs 1970 1974 Surgery reduced by 80% 1980 $28,000 $900 (TagametZantac) 1990
Ageing Populations Medicine - a healthy investment prospect Exceptional long-term growth Biotechnology revolution
New(ish) area of medical research: Based more on biology than chemistry Companies sell: Drug discovery technologies (“tools”) Drugs Biotechnology: what is it?
1985 - 1995 Run by academics Capital constraints Few drugs Celebrated implosions Investor fatigue Now Experienced management 10yrs of capital inflows Technologies and products generating cash flows Strong balance sheets Demonstrated medical benefits Explosive growth phase just begun Biotechnology then and now
New technologies grow exponentiallyGenomics at an earlier stage than computing Transistors/Sequences (m) Source: Intel, Genbank (US NIH), Colonial First State
Big Pharma facing R&D productivity gap Pipelines too thin to sustain historic growth rates (viz. GSK, Roche) Huge demand for late-stage (Phase II/III) drugs Biotechnology companies striking tougher deals Traditional pharma research methods inefficient 95% failure rate for drugs $70bn market for providers of the new bio-technologies Biotechnology: commercial growth drivers
Biotechnology: commercial growth drivers - continued….. • Genomics / proteomics drives uptick in drug opportunities • Previous century: 500 drug targets • Next five years: 5000 new drug targets • Focus now on sifting new targets to find which are “drugable” • Some new drugs already produced (cancer, arthritis, sepsis, lymphoma)
Colonial First State InvestmentsGlobal Health & Biotechnology Fund
GHAB performance (+22.4% in first 10 months) 160 150 140 130 120 110 100 90 Jul 00 Jun 00 Oct 00 Jan 01 Nov 00 Aug 00 May 00 Sep 00 Apr 00 Dec 00 Source: Colonial First State, MSCI
GHAB versus All Ordinaries Source: Colonial First State, MSCI
160 MSCI Healthcare Index $A Colonial First State 150 140 130 120 110 100 90 Jul 00 Jun 00 Oct 00 Jan 01 Nov 00 Apr 00 Aug 00 May 00 Dec 00 Sep 00 GHAB versus benchmark Source: Colonial First State, MSCI
160 MSCI Healtcare index $A NASDAQ Biotech index $A 150 Colonial First State 140 130 120 110 100 90 Jul 00 Jun 00 Oct 00 Jan 01 Nov 00 Apr 00 Aug 00 May 00 Dec 00 Sep 00 GHAB versus benchmark and biotech index Source: Colonial First State, MSCI
9000 NASDAQ COMPOSITE - PRICE INDEX 8000 NASDAQ BIOTECHNOLOGY - PRICE INDEX 7000 6000 5000 4000 3000 2000 1000 1998 1999 2000 2001 Biotech decoupling from Nasdaq? From 19 January 1998 To 12 February 2001 Weekly Rebased Source: Datastream
Strong Revenue Growth Innovative drugs US exposure Strong R&D Pipeline Low profit margin risk Low patent risk Divestments rather than M&A Pharma stocks (Av. CAGR 15-17%) We look for:
50 48 46 44 42 40 38 36 34 32 30 FEB APR JUN AUG OCT DEC FEB HIGH 48.94 11/ 7/00 LOW 30.50 7/ 3/00 LAST 46.12 World leading blue chip From 11 February 2000 TO 12 February 2001 Daily • Impressive drugs portfolio • 7 drugs > $1bn • 5 drugs > $500m • No patent expiries for 5 yrs • Global R&D • World-class sales force Source: DATASTREAM
55 50 45 40 35 30 25 20 FEB APR JUN AUG OCT DEC FEB HIGH 53.94 11/12/00 LOW 21.00 31/ 3/00 LAST 44.02 King: mid-cap “specialty” pharmaceuticals KING PHARMS. From 11February 2000 To 13 February 2001 Daily • Adds value to mature drugs • Acquired 36 branded drugs since 1993 • Big pharma co.s set to sell more • Focus on promotion-sensitive drugs • Big hit with heart drug - Altace • Only ACE drug to reduce death rate • Big marketing partner (AHP) • Expect growth of 34% in 2000 - 05 • Acquired Jones Pharmaceuticals • Expanded sales force • Improved Balance Sheet Source: DATASTREAM
Platform technology Products Services Upfront payments Milestones License fees Royalties Biotechnology stocks (Av. CAGR 24%) Partnerships with big cap pharma We look for:
90 80 70 60 50 40 30 20 FEB APR JUN AUG OCT DEC FEB Millennium: world-class genetic “tools”: company MILLENNIUM PHARMS. From 11 February 2000 To 12 February 2001 Daily • Contract genomics R&D • boosts client’s R&D productivity • $1.8bn fees from Big Pharma • In-house drug development • 5 products in clinical testing • Leukaemia, stroke, asthma • Leader “predictive medicine” HIGH 86.50 7/11/00 LOW 26.19 17/ 4/00 LAST 41.31 Source: DATASTREAM
IDEC: drug-producing biotechnology company IDEC PHARMACEUTICALS From 11 February 2000 To 12 February 2001 Daily • Profitable • First antibody (smart- bomb) for cancer (Rituxan) • Radioactive version soon • Good marketing partner - Genentech • Good R&D pipeline • 5 drugs in clinical development • Focus on immune disorders 80 70 60 50 40 30 20 10 FEB APR JUN AUG OCT DEC FEB HIGH 75.08 18/12/00 LOW 19.12 24/ 4/00 LAST 61.75 Source: DATASTREAM
Global health & biotechnology shares in an investment portfolio
A long-term history of strong returns Annual investment returns of MSCI Health Care index to 31 December 2000 in Australian dollars Source: Morgan Stanley Capital International
An attractive risk/return profile Source: IRESS, MSCI. Calculated for period - 10 years to 31 December 2000
Global health & biotechnology enhances returns from Australian shares Source: Colonial First State, MSCI, IRESS. Calculated for period 10 years to 31 December 2000
Global health & biotechnology enhances returns from global shares Annual return (%pa) Annualised standard deviation (%pa) Source: Colonial First State, MSCI, IRESS. Calculated for period 10 years to 31 December 2000
Enormous long-term growth potential Defensive, stable earnings Revolutionary technology A hedge against future liabilities Summary: health stocks offer
Disclaimer This information has been prepared without taking into account your particular financial situation. Before making an investment decision based on this advice, you should assess your own position, and if appropriate, seek the assistance of a financial adviser.