Download

1 / 17
170 likes | 197 Views
Learn the basics of Repeated Measures ANOVA, statistical analysis for balanced designs, subject and item analyses, SPSS examples, and interpreting results using SPSS.

E N D
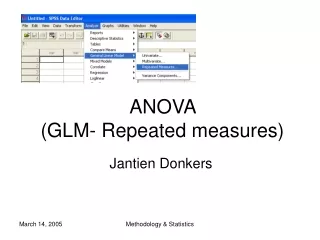
Repeated measures ANOVA LabSyntax, 02/23/06 T. Florian Jaeger
Intro • Basis idea: • We’re interested in populations • The sample of subjects & items we see is (so we hope/assume) representative for the population, but not identical • I.e. we assume that we observe the effect of our manipulation on a randomly selected sample of the population of interest (e.g. native speakers of English; question-embedding verbs) • What this means: • The statistical analysis should reflect our assumptions Subjects and Items are random effects/factors
What does it mean to be a random effect? • Not all levels of the effect are observed in the experiment • Sometimes we have such specific research questions that we DO observe all levels (in terms of items), consider e.g. irregular verbs with a specific stress pattern. • For corpus work: the # of levels for a random effect usually increases as the sample size increases
The standard (psycholinguistic) analysis • ANOVA (Analysis of variance) • Designed for balanced design (unreliable for unbalanced designs) • Check other assumptions (normally distributed error, sphericity/homogeneity of variance), e.g. Howell 1995 • Separate subject (F1) and item (F2) analyses: • F1: for each subject average/aggregate within each condition over all items • F2: for each item average/aggregate within each condition over all subjects • Advantage: even for missing cells, averaging gives you a mean value for each condition for each subject/item
Repeated Measures in SPSS • Open file, import data 1st subject, Subject ID=0 20 items Design: 2 (LIKE) x 2 (WAY) UCP1.DIFF.CONJ He wants to go to the movies and mini-golfing. UCP1.SAME.CONJ He wants to go to the movies and to the mini-golf course. UCP1.DIFF.REPAIR He wants to go to the movies, I mean, mini-golfing. UCP1.SAME.REPAIR He wants to go to the movies, I mean, to the mini-golf course.
Repeated Measures in SPSS, e.g. F1 • Open file, import data • Aggregate (e.g. over items) Data Aggregate
Repeated Measures in SPSS, e.g. F1 • Open file, import data • Aggregate (e.g. over items) Data Aggregate • Open aggregate file • Restructure Data Restructure
Repeated Measures in SPSS, e.g. F1 • Open file, import data • Aggregate (e.g. over items) Data Aggregate • Open aggregate file • Restructure Data Restructure Then go “Next” “Next” “Next” “Finish”
Repeated Measures in SPSS, e.g. F1 • Open file, import data • Aggregate (e.g. over items) Data Aggregate • Open aggregate file • Restructure Data Restructure • Check! Look at output and data • SAVE!! 1 subject per line All 2 x 2 = 4 conditions in Columns in that line
Repeated Measures in SPSS, ANALYSIS • Start repeated measures Analysis GLM repeated measures • Define factors and measure
Repeated Measures in SPSS, ANALYSIS • Start repeated measures Analysis GLM repeated measures • Define factors and measure • Define levels Make sure order is right!
Repeated Measures in SPSS, ANALYSIS • Start repeated measures Analysis GLM repeated measures H • Define factors and measure • Define levels Make sure order is right! • Define some plots • Optionally post-hoc tests LIST could go here, as could AGE, GENDER, etc. Frequency, Length could be entered as covariates Add e.g. interaction plot
Repeated Measures in SPSS, Results Sphericity is not an issue with binary factors But with more levels: check whether sphericity holds (Mauchly’s test) If not, use Greenhouse-Geisser
Repeated Measures in SPSS, Results (plots) • Be aware that plots use marginal means (not the same as means) • To read plots, look at Within-subject Factors DIFF.CONJ He wants to go to the movies and mini-golfing. SAME.CONJ He wants to go to the movies and to the mini-golf course. DIFF.REPAIR He wants to go to the movies, I mean, mini-golfing. SAME.REPAIR He wants to go to the movies, I mean, to the mini-golf course.
Repeated Measures in SPSS, do results hold? • Item analysis Interaction not confirmed by F2 analysis But less power (look at DF of error, 19 instead of 86) Probably small effect size Exaggerated MORAL: Wasted subjects! Lots of power in terms of subjects does not help with F2 analysis!
The previous example was taken from a study by John Hale (in progress) not to be cited or circulated without his permission.