Repeated Measures ANOVA: Statistical Notation and Formula Considerations
380 likes | 421 Views
Understand the statistical notation and key formula considerations for Repeated Measures ANOVA, with practical examples and hypothesis testing included. Learn how to calculate SS, dftotal, MS, F-ratio, and analyze within and between treatments. Enhance your knowledge in quantitative methods.

Repeated Measures ANOVA: Statistical Notation and Formula Considerations
E N D
Presentation Transcript
Repeated Measures ANOVA Quantitative Methods in HPELS HPELS 6210
Agenda • Introduction • The Repeated Measures ANOVA • Hypothesis Tests with Repeated Measures ANOVA • Post Hoc Analysis • Instat • Assumptions
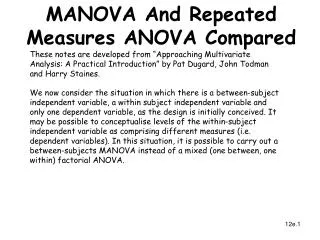
Introduction • Recall There are two possible scenarios when obtaining two sets of data for comparison: • Independent samples: The data in the first sample is completely INDEPENDENT from the data in the second sample. • Dependent/Related samples: The two sets of data are DEPENDENT on one another. There is a relationship between the two sets of data.
Introduction • Three or more data sets? • If the three or more sets of data are independent of one another Analysis of Variance (ANOVA) • If the three or more sets of data are dependent on one another Repeated Measures ANOVA
Agenda • Introduction • The Repeated Measures ANOVA • Hypothesis Tests with Repeated Measures ANOVA • Post Hoc Analysis • Instat • Assumptions
Repeated Measures ANOVA • Statistical Notation Recall for ANOVA: • k = number of treatment conditions (levels) • nx = number of samples per treatment level • N = total number of samples • N = kn if sample sizes are equal • Tx = SX for any given treatment level • G = ST • MS = mean square = variance
Repeated Measures ANOVA • Additional Statistical Notation: • P = total score for each subject (personal total) • Example: If a subject was assessed three times and had scores of 3, 4, 5 P = 12
Repeated Measures ANOVA • Formula Considerations Recall for ANOVA: • SSbetween = ST2/n – G2/N • SSwithin = SSSinside each treatment • SStotal = SSwithin + SSbetween • SStotal = SX2 – G2/N
ANOVA • Formula Considerations: • dftotal = N – 1 • dfbetween = k – 1 • dfwithin = S(n – 1) • dfwithin = Sdfin each treatment
ANOVA • Formula Considerations: • MSbetween = s2between = SSbetween / dfbetween • MSwithin = s2within = SSwithin / dfwithin • F = MSbetween / MSwithin
Repeated Measures ANOVA • New Formula Considerations: • SSbetween SSbetween treatments = ST2/n – G2/N • SSbetween subjects = SP2/k – G2/N • SSwithin SSwithin treatments = SSSinside each treatment • SSerror = SSwithin treatments – SSbetween subjects
Repeated Measures ANOVA • New Formula Considerations: • dfbetween dfbetween treatments = k – 1 • dfwithin dfwithintreatments = N – k • dfbetween subjects = n – 1 • dferror = (N – k) – (n – 1)
Repeated Measures ANOVA • MSbetween treatments=SSbetween treatments/dfbetweentreatments • MSerror = SSerror / dferror • F = MSbetween treatments / MSerror
Repeated Samples Designs • One-group pretest posttest (repeated measures) design: • Perform pretest on all subjects • Administer treatments followed by posttests • Compare pretest to posttest scores and posttest to posttest scores O X O X O
Agenda • Introduction • The Repeated Measures ANOVA • Hypothesis Tests with Repeated Measures ANOVA • Post Hoc Analysis • Instat • Assumptions
Hypothesis Test: Repeated Measuers ANOVA • Example 14.1 (p 457) • Overview: • Researchers are interested in a behavior modification technique on outbursts in unruly children • Four students (n=4) are pretested on the # of outbursts during the course of one day • Teachers begin using “cost-response” technique • Students are posttested one week later, one month later and 6 months later
Hypothesis Test: ANOVA • Questions: • What is the experimental design? • What is the independent variable/factor? • How many levels are there? • What is the dependent variable?
Step 1: State Hypotheses Non-Directional H0: µpre = µ1week =µ1month = µ6months H1: At least one mean is different than the others Table B.4 (p 693) Critical value = 3.86 Step 2: Set Criteria Alpha (a) = 0.05 Critical Value: Use F Distribution Table Appendix B.4 (p 693) Information Needed: dfbetween treatments = k – 1 = 4 – 1 = 3 dferror = (N-k)-(n-1) = (16-4)-(4-1) = 9
Step 3: Collect Data and Calculate Statistic Total Sum of Squares SStotal = SX2 – G2/N SStotal = 222 – 442/20 SStotal = 222 - 121 SStotal = 101 Sum of Squares Between each Treatment SSbetween treatment = ST2/n – SG2/N SSbetween treatment = 262/4+82/4+62/4+42/4 – 442/20 SSbetween treatment = (169+16+9+4) - 121 SSbetween treatment = 77 Sum of Squares Within each Treatment SSwithin = SSSinside each treatment SSwithin = 11+2+9+2 SSwithin = 24 Sum of Squares Error SSerror = SSwithin treatments – SSbetween subjects SSerror = 24 - 13 SSwithin = 11 Sum of Squares Between each Subject SSbetween subjects = SP2/k – SG2/N SSbetween subjects = (122/4+62/4+102/4+162/4) - 442/16 SSbetween subjects = (36+9+25+64) – 121 SSbetweensubjects = 13 Raw data can be found in Table14.3 (p 457)
Step 3: Collect Data and Calculate Statistic F-Ratio F = MSbetween treatment / MSerror F = 25.67 / 1.22 F = 21.04 Mean Square Between each Treatment MSbetween treatment = SSbetween treatment / dfbetween treatment MSbetween treatment = 77 / 3 MSbetween = 25.67 Step 4: Make Decision Mean Square Error MSerrorn = SSerror / dferror MSerror = 11 / 9 MSwithin = 1.22
Agenda • Introduction • Repeated Measures ANOVA • Hypothesis Tests with Repeated Measures ANOVA • Post Hoc Analysis • Instat • Assumptions
Post Hoc Analysis • What ANOVA tells us: • Rejection of the H0 tells you that there is a high PROBABILITY that AT LEAST ONE difference exists SOMEWHERE • What ANOVA doesn’t tell us: • Where the differences lie • Post hoc analysis is needed to determine which mean(s) is(are) different
Post Hoc Analysis • Post Hoc Tests: Additional hypothesis tests performed after a significant ANOVA test to determine where the differences lie. • Post hoc analysis IS NOT PERFORMED unless the initial ANOVA H0 was rejected!
Post Hoc Analysis Type I Error • Type I error: Rejection of a true H0 • Pairwise comparisons: Multiple post hoc tests comparing the means of all “pairwise combinations” • Problem: Each post hoc hypothesis test has chance of type I error • As multiple tests are performed, the chance of type I error accumulates • Experimentwise alpha level: Overall probability of type I error that accumulates over a series of pairwise post hoc hypothesis tests • How is this accumulation of type I error controlled?
Two Methods • Bonferonni or Dunn’s Method: • Perform multiple t-tests of desired comparisons or contrasts • Make decision relative to a / # of tests • This reduction of alpha will control for the inflation of type I error • Specific post hoc tests: • Note: There are many different post hoc tests that can be used • Our book only covers two (Tukey and Scheffe)
Repeated Measures ANOVA • Bonferronni/Dunn’s method is appropriate with following consideration: • Use related-samples T-tests • Tukey’s and Scheffe is appropriate with following considerations: • Replace MSwithin with MSerror in all formulas • Replace dfwithin with dferror in all formulas • Note: Statisticians are not in agreement with post hoc analysis for Repeated Measures ANOVA
Agenda • Introduction • The Repeated Measures ANOVA • Hypothesis Tests with Repeated Measures ANOVA • Post Hoc Analysis • Instat • Assumptions
Instat • Label three columns as follows: • Block: This groups your data by each subject. • Example: If you conducted a pretest and 2 posttests (3 total) on 5 subjects, the block column will look like: • 1 1 1 2 2 2 3 3 3 4 4 4 5 5 5 • Treatment: This tells you which treatment level/condition occurred for each data point. • Example: If each subject (n=5) received three treatments, the treatment column will look like: • 1 2 3 1 2 3 1 2 3 1 2 3 1 2 3 • Response: The data for each subject and treatment condition
Instat • Convert the “Block” and “Treatment” columns into “factors”: • Choose “Manage” • Choose “Column Properties” • Choose “Factor” • Select the appropriate column to be converted • Indicate the number of levels in the factor • Example: Block (5 levels, n = 5), Treatment (3 levels, k = 3) • Click OK
Instat • Choose “Statistics” • Choose “Analysis of Variance” • Choose “General” • Response variable: • Choose the Response variable • Treatment factor: • Choose the Treatment variable • Blocking factor: • Choose the Block variable • Click OK. • Interpret the p-value!!!
Instat • Post hoc analysis: • Perform multiple related samples t-Tests with the Bonferonni/Dunn correction method
Reporting ANOVA Results • Information to include: • Value of the F statistic • Degrees of freedom: • Between treatments: k – 1 • Error: (N – k) – (n – 1) • p-value • Examples: • A significant treatment effect was observed (F(3, 9) = 21.03, p = 0.002)
Reporting ANOVA Results • An ANOVA summary table is often included
Agenda • Introduction • The Analysis of Variance (ANOVA) • Hypothesis Tests with ANOVA • Post Hoc Analysis • Instat • Assumptions
Assumptions of ANOVA • Independent Observations • Normal Distribution • Scale of Measurement • Interval or ratio • Equal variances (homogeneity) • Equal covariances (sphericity) • If violated a penalty is incurred
Violation of Assumptions • Nonparametric Version Friedman Test (Not covered) • When to use the Friedman Test: • Related-samples design with three or more groups • Scale of measurement assumption violation: • Ordinal data • Normality assumption violation: • Regardless of scale of measurement
Textbook Assignment • Problems: 5, 7, 10, 23 (with post hoc)