Aqueous Corrosion Data
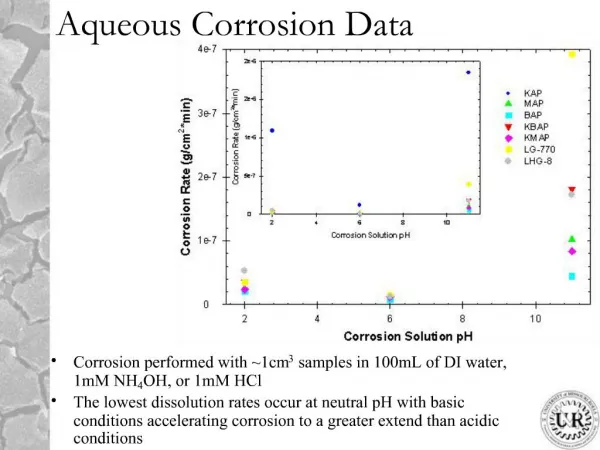
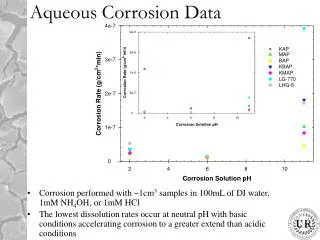
Aqueous Corrosion Data. Corrosion performed with ~1cm 3 samples in 100mL of DI water, 1mM NH 4 OH, or 1mM HCl The lowest dissolution rates occur at neutral pH with basic conditions accelerating corrosion to a greater extend than acidic conditions. pH Changes of Corrosion Solutions.

Aqueous Corrosion Data
E N D
Presentation Transcript
Aqueous Corrosion Data • Corrosion performed with ~1cm3 samples in 100mL of DI water, 1mM NH4OH, or 1mM HCl • The lowest dissolution rates occur at neutral pH with basic conditions accelerating corrosion to a greater extend than acidic conditions
pH Changes of Corrosion Solutions 1mM HCl pH 2.5 initially DI water pH 6.0 initially • Except for KAP see very little change for the acid and DI water solutions. • The basic solution, however, shows a larger pH shift to go along with the increased dissolution rates on the previous slide. 1mM NH4OH pH 10.5 initially
Arrhenius Fit of Dissolution Data • Samples were corroded at temperatures from 25 to 90ºC • The data was fit to an arrhenius equation to calculate dissolution activation energies • The table shows the calculated energies for several of the studied glass samples
pH stat Titration of Glass Samples • The graph to right shows the pH stat curves for the glasses at a pH of 9.2. • KAP reacts at a much faster rate than the other glasses. • The slope of the curves at longer times is compared to the free energy of hydration of the oxides in the table.
Initial Reaction of Glass Species • The short term pH shift of the glass samples can give a description of the number of reactive groups on the surface of each glass sample. • The samples shown here are for glasses with an initial pH 9.2 • KAP shows the most shift, with KMAP close.
pH shift measurements of Glasses • Glass is added to a solution of desired pH and the shift in pH for the first 60s is measured. This is used to calculated the moles of OH adsorbed by the glass surface. • While there is some scatter as of yet, it can be seen that KAP and KMAP appear to follow the same trend. • The other glass are somewhat lower than this trend initially and all of the glasses begin to come together near a pH of 7.
Predominance Diagrams for KAP and KBAP • For KBAP appear to see multiple stable phases present at lower pH, but only one system shown at basic pH • KAP on the other hand shows little other than the K+ ion for most of the plot. • Further study of the diagrams may provide clues into the reactions affecting glass dissolution in each species.
Weathering of Glass Samples • KAP powder was weathered for different times at 80% RH and 50ºC • Samples were removed and TGA experiments performed to determine weight loss • Samples show two weight loss regions, possibly one due to surface adsorbed water and the other due to reacted species. Adsorbed Water Reacted Water
ERD for H depth profiles • ERD was performed on a series of glass samples to measure the hydrogen depth profiles as a function of corrosion time at 50ºC and 80%RH. • After only one day of corrosion KAP has corroded beyond the depth limit of the ERD measurement.
ERD of KMAP and KBAP • KMAP shows less water to begin with, but by 1 week of corrosion KMAP and KBAP have roughly the same depth profiles.
Chain Distribution of Weathered Layer • Liquid Chromatography provides information about chain distributions.. • The top figure shows the distribution for a series of weathered KMAP glasses. • Orthophosphate units replace longer chains with weathering. • The bottom figure compares the changes in average chain length for the KMAP and KAP glasses.
MAS-NMR of KBAP Weathering • The spectra on the left are 31P MAS spectra of the KBAP glasses after 0, 1, and 7 days of corrosion at 50ºC and 80%RH. • The spectra on the right are the 1H-31P Cp-MAS spectra showing the phosphorus resonances that interact with water in the samples. • The water has very little effect on the overall spectra of the glasses and is mostly interacting with Q1 and Q0 units in the glass structure. x16
MAS-NMR of KAP Weathering • The spectra on the left are 31P MAS spectra of the KAP glasses after 0, 1, and 7 days of corrosion at 50ºC and 80%RH. • The spectra on the right are the 1H-31P Cp-MAS spectra showing the phosphorus resonances that interact with water in the samples. • In this case the water has a large effect on the overall spectra showing a number of new resonances due to the presence of a variety of PO4-OHx units. x8
2d spectra of the KAP 7 Day sample • The 31P profile is on the x-axis and the 1H on the y-axis in the plot. • The 2D spectra shows the presence of two different species of water. The 1H species at 5ppm is due to adsorbed water and can be seen interacting with a number of different phosphorus environments. • The 15ppm 1H is due to more strongly interacting water, most likely in the form of P-OH only seen attached to most likely Q1 units.
27Al Spectra of Corroded Glasses KAP 7days • 27Al spectra of KAP and KBAP show that much less of the Al is correlated to 1H in the corroded samples than in the bulk glass. • Partially this is due to the limited reaction depth of the water, but may also be due to an inhibiting effect of aluminum keeping OH groups away from the phosphate species. 32,000 scans 1H-27Al CPMAS 27Al Direct MAS KBAP 7days 232,000 scans 1H-27Al CPMAS 27Al Direct MAS
Thin Film XRD of Weathered Surfaces • KH2PO4 crystals on appear KAP surface and AlPO4 crystals on the surface of BAP and KBAP in addition to the KH2PO4 .
Additional Crystal Species • What can be seen for the KBAP spectra is that additional species such as K2HPO4 and Al(OH)3 can be used to describe some of the peaks. • Additional species such as Ba3(PO4)2, AlOOH, and Ba(OH)2 may also be present. • At this moment, however, the low angle peak can only be due to AlPO4
Optical Microscopy Images of Fibers Before After • LG-770 fibers before and after dipping in LN2 • There appears to be no noticeable difference between the two fibers • All fibers were corroded for ~3 weeks at 100% RH at room temperature • LHG-8 from the same pull showing a wide range of surface features. • LHG-8 also showed no change in surface characteristics before and after LN2 dipping
AFM images of Glass Fibers LG-770 Fresh Pulled Fiber 14 Days Drierite 14 days 100% RH LHG-8
Failure Strain Data for 1 week • In the prior slide see that LG-770 fibers show a small number of large corrosion points ~ 50nm in height and 1mm in diameter with little to no roughness of the surface other than that. • LHG-8 exhibits more surface roughness, ~5nm, but lacks the large peaks seen in LG-770. • Strength data for 1 week of corrosion at a variety of RH’s. • Both glasses appear to follow the same trend.
Upcoming Work • Work planned for this spring and summer includes: • Corrosion and Weathering of KCAP and CAP samples for comparison to the rest of the data. It may be that KMAP acts more like KAP due to some ionic radii comparisons which KCAP may give more insight to. • Further NMR correlation measurements to determine which species are being preferentially attacked during the weathering process. • pH stat and drift measurements in the acidic region to determine if the same trends continue. • Liquid NMR measurements of short term corrosion surfaces to determine the weathering and hydrolysis rates of each glass surface. • Calculation of more predominance diagrams to look for the effect of stable solution species on corrosion rates. • Further weathering tests in more humidity/temperature environments for trending of corrosion. • Study of Iron phosphates looking specifically on the affect of modifier composition on the corrosion stability of glasses. • I am also looking at using this data to compare to some of the strength and fatigue measurements on glass fibers that Nate and Adam have performed to see if it can help explain some of their results.