Download
1 / 59
590 likes | 691 Views
Detailed analysis of radiation exposure sources, doses, and impact on health, including natural background, medical procedures, consumer products, and occupational exposure.

E N D
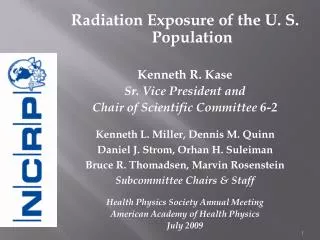
Radiation Exposure of the U. S. Population Kenneth R. Kase Sr. Vice President and Chair of Scientific Committee 6-2 Kenneth L. Miller, Dennis M. Quinn Daniel J. Strom, Orhan H. Suleiman Bruce R. Thomadsen, Marvin Rosenstein Subcommittee Chairs & Staff Health Physics Society Annual Meeting American Academy of Health Physics July 2009
Members of SC 6-2 Natural Background • Daniel J. Strom • Alan Birchall • Thomas B. Borak • David J. Brenner • Paul E. Goldhagen • Keran O’Brien III • Jerome S. Puskin • Thomas F. Gesell* • Anthony James* * Consultants Medical Patient • Bruce R. Thomadsen • Mythreyi Bhargavan • Debbie B. Gilley • Joel E. Gray • Jill A. Lipoti • Mahadevappa Mahesh • John L. McCrohan • Fred A. Mettler, Jr. • Terry T. Yoshizumi
Members of SC 6-2 Consumer Products • Orhan H. Suleiman • Jennifer Goodman • Raymond H. Johnson, Jr. • Cheryl K. Rogers • Paul W. Frame* • Ronald L. Kathren* Industrial • Dennis M. Quinn • Ralph Andersen • Regis A. Greenwood • Cynthia G. Jones *Consultants Occupational Exposure • Kenneth L. Miller • David J. Allard • Kelly Classic • Michael A. Lewandowski • Kathleen L. Shingleton • George J. Vargo Sources • E. Scott Medling • Carl J. Paperiello • Linda M. Sewell
Outline • Overview of Report • Exposure from Ubiquitous Natural Background, including Radon • Exposure to Patients from Medical Procedures • Exposure from Consumer Products and Activities • Exposure from Industrial, Security, Medical, Educational and Research Activities • Occupational Exposure • Summary
Overview • NCRP Report No. 93: Exposure of the U.S. population to ionizing radiation as of the early 1980s. • Population dose has increased because the population has increased, but • Individual dose has also increased from medical procedures to exposed individuals; • Individual and population doses from various other sources have changed.
Overview • Results are presented as annual values for: • average effective dose to an individual in a group exposed to a specific source (EExp) (mSv); • collective effective dose (S) (person-Sv); • and effective dose per individual in the U.S. population (EUS) (mSv). • Variation of dose and uncertainties in dose are discussed. • Doses reported are not suitable for use in risk assessment.
Ubiquitous Background • Four subcategories grouped by the origin of the source: • external exposure from space radiation (solar particles and cosmic rays); • external exposure from terrestrial radiation (primarily from 40K and the 238U and 232Th decay series); • internal exposure from inhalation of radon and its progeny; • and internal exposure from radionuclides in the body (primarily 40K).
Terrestrial Radiation Annual Effective Dose = 0 .21 mSv
Radon Dose • For indoor exposure an average concentration in U.S. residences of 46.3 Bq m3 is used. • The average annual potential alpha energy exposure is estimated to be 0.207 WLM. • Over 40 calculations of dose conversion coefficients show a lognormal distribution with an arithmetic mean of 10 mSv WLM−1 and a standarddeviation of 5 mSv WLM−1. • The average adult in the United States receives an annual effective dose to the bronchial epithelium of 2.07 mSv
Radon Dose • Annual Effective Dose: • From Rn-222 decay products = 2.07 mSv • From Rn-222 gas = 0.05 mSv • From Rn-220 gas & decay products = 0.16 mSv • Total Annual Effective Dose from radon 2.3 mSv
Internally Deposited Radionuclides • Annual Effective Dose from K-40 • Males – 0.149 (0.069 – 0.243) mSv • Females – 0.123 (0.067 – 0.203) mSv • Avg., male & female – 0.136 mSv • Annual Effective Dose from Th-232, U-238 • Avg., male & female – 0.127 (0.050 – 0.138) mSv • Infants – 0.132 mSv; children – 0.114 mSv • Others (C-14, Rb-87) – 0.01 mSv • Total Annual Effective Dose 0.28 mSv
Population Dose (person-Sv) from Sources of Ubiquitous Background Radiation
Medical Exposure of Patients • Five subcategories grouped by type of medical modality: • computed tomography; • conventional radiography and fluoroscopy; • interventional fluoroscopy; • nuclear medicine; and • Radiotherapy (results were not included in the total because of unique considerations).
Computed Tomography • Total Annual Collective Effective Dose (S): 437,500 person Sv
Conventional Radiography and Fluoroscopy • Annual Collective Effective Dose (S) : 100,500 person Sv (116,800 person-Sv using ICRP 2007 weighting factors for breast and dental exposures)
Interventional Fluoroscopy • Total number of procedures: 16,735,650 • Annual Collective Effective Dose (S): 128,400 person-Sv
Change in Nuclear Medicine Procedures 60 1973 50 1982 40 2005 30 Percent of Total 20 10 0 GI Lung Bone Brain Other Renal Tumor Cardiac Thyroid Infection Procedure Nuclear Medicine
Nuclear medicine: Age distribution, 2003 Relative to the US population age distribution 25% 20% 15% 10% 5% 0% 0-10 11-17 18-24 25-34 35-44 45-54 55-64 65-74 75-84 85 and older % of procedures % of population Nuclear Medicine
Nuclear Medicine • Total number of procedures: 18,100,000 • Annual Collective Effective Dose: 231,000 person-Sv
Radiation Therapy • Total number of patients: 872,000 • Annual collective effective dose: 354,000 person-Sv • Effective dose per patient: 406 mSv
Population Dose (person-Sv) from Medical Exposure of Patients
Consumer Products & Activities • Eight subcategories grouped by the origin of the source: • cigarette smoking, • building materials, • commercial air travel, • mining and agriculture, • combustion of fossil fuels, • domestic water supplies, • highway and road construction materials, and • glass and ceramics.
Consumer Products & Activities • Potential sources that are not discussed further in this Report (refer to NCRP, 1987d, Table 5.1) include: • Dental prostheses • Opthalmic glass • Luminous watches and clocks • Gas and aerosol (smoke) detectors • Electron tubes • Thorium products (including gas mantles and welding rods).
Building Materials • Analyzed the dose from the use of coal combustion products in buildings – similar to dose from brick & masonry • Assumed that the radiation dose to individuals living in brick and masonry buildings has not changed since the estimates made in the 1980s • Assumed that 50 % of population lives in brick and masonry buildings • Use of zircon glazed tiles and fixtures, granite countertops, desktops, wall and floor tiles, and marble could add a small additional collective dose
Building Materials • Annual collective effective dose: 10,500 person-Sv
Commercial Air Travel • Domestic: • 660.7 million passengers • Average dose rate - 3.30 μSv per air hour (SD = 1.81 µSv/h) • Average air time - 2.84 h. • International: • 84.8 million passengers on U. S. carriers • Average dose rate - 5.21 μSv per air hour (SD = 0.94 μSv/h) • Average air time - 9.35 h.
Commercial Air Travel • Annual collective effective dose: 10,300 person-Sv
Other Sources Other Sources include: dental prostheses, opthalmic glass, luminous watches and clocks, gas and aerosol (smoke) detectors, electron tubes, and thorium products (including gas mantles and welding rods).
Population Dose (person-Sv) from Exposure to Consumer Products & Activities
Industrial, Security, Medical, Educational and Research Activities • Six subcategories grouped by activity and associated type of source: • nuclear medicine patients; • nuclear power generation; • industrial, medical, educational and research activities; • DOE installations; • decommissioning and radioactive waste; • security imaging systems.
Nuclear Medicine Patients • Procedures performed: 8 million • Persons (family and coworkers) exposed during each procedure: 4 • Effective dose per procedure (NCRP Report No. 124, 1996): 10 μSv • Annual collective effective dose: 720 person-Sv
Nuclear Power Generation • Operating nuclear power plants in the U S: 104 • Installed capacity: 100 Gwe • Capacity factor: 89.6 % • Power generation: 90 GWe • Annual collective effective dose: 153 person-Sv
Population Dose (person-Sv) from Industrial, Security, Medical, Educational and Research Activities
Occupational Exposure • Six subcategories grouped by the nature of employment and associated type of source: • medical; • aviation; • commercial nuclear power; • industry and commerce; • education and research; and • government, DOE and military.