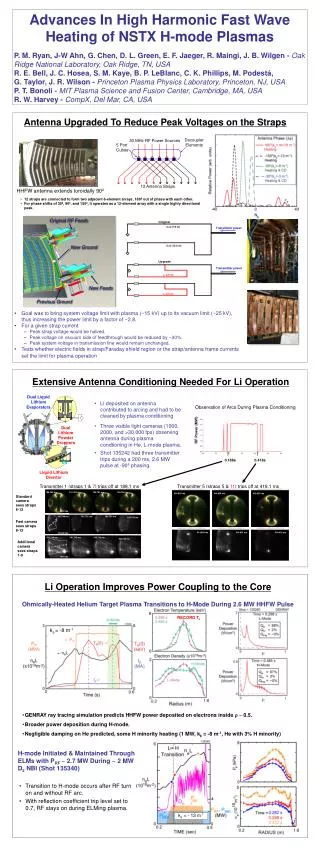
Exploring Electron Bernstein Wave Emission for Te(R) Profile Measurements in NSTX Plasma Research
330 likes | 510 Views
This paper discusses the innovative use of Electron Bernstein Wave (EBW) emission for measuring electron temperature profiles (Te(R)) within the National Spherical Torus Experiment (NSTX). Collaborating with various institutions, the research focuses on optimizing the transmission efficiency of the B-X-O diagnostics, which is crucial for accurate Te(R) reconstructions. Key findings include the significance of modeling emission locations and the challenges of microwave propagation in dense plasmas, as well as the potential of remotely steered antennas to enhance measurement reliability and spatial mapping of thermal emissions.

Exploring Electron Bernstein Wave Emission for Te(R) Profile Measurements in NSTX Plasma Research
E N D
Presentation Transcript
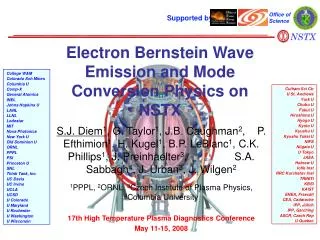
Office of Science Supported by Electron Bernstein Wave Emission and Mode Conversion Physics on NSTX College W&M Colorado Sch Mines Columbia U Comp-X General Atomics INEL Johns Hopkins U LANL LLNL Lodestar MIT Nova Photonics New York U Old Dominion U ORNL PPPL PSI Princeton U SNL Think Tank, Inc. UC Davis UC Irvine UCLA UCSD U Colorado U Maryland U Rochester U Washington U Wisconsin Culham Sci Ctr U St. Andrews York U Chubu U Fukui U Hiroshima U Hyogo U Kyoto U Kyushu U Kyushu Tokai U NIFS Niigata U U Tokyo JAEA Hebrew U Ioffe Inst RRC Kurchatov Inst TRINITI KBSI KAIST ENEA, Frascati CEA, Cadarache IPP, Jülich IPP, Garching ASCR, Czech Rep U Quebec S.J. Diem1, G. Taylor1, J.B. Caughman2, P. Efthimion1, H. Kugel1, B.P. LeBlanc1, C.K. Phillips1, J. Preinhaelter3, S.A. Sabbagh4, J. Urban3, J. Wilgen2 1PPPL, 2ORNL, 3Czech Institute of Plasma Physics, 4Columbia University 17th High Temperature Plasma Diagnostics Conference May 11-15, 2008
EBW emission may be used for Te(R) profile measurements in the Spherical Torus (ST) • NSTX assessing the feasibility of EBE based Te(R) measurements • Measure oblique B-X-O emission covering fce, 2fce & 3fce • EBE diagnostic developed in collaboration with ORNL • Need to optimize B-X-O transmission efficiency (CB-X-O) for robust measurements • CB-X-O depends on Ln, Te, ce/ at mode conversion layer • Remotely steered antennas allow for investigating angular dependence on transmission level • Modeling required to determine emission location and calculate CB-X-O for Te(R) reconstruction • EBE simulation code developed by Preinhaelter & Urban at Czech Institute of Plasma Physics
Low harmonic EC waves do not propagate in the ST • ECE well established as a Te(R,t) diagnostic in conventional high aspect ratio tokamaks • EC waves cannot propagate in overdense plasmas: pe >> ce • NSTX has low B-fields and high ne, cutting off up to first 6 EC harmonics • EBWs are strongly emitted from EC harmonics • EBWs cannot propagate in vacuum outside upper hybrid resonance (UHR) layer Need efficient coupling from EBWs to EM waves for viable diagnostic measurements
EBW coupling to electromagnetic waves • EBW emitted at EC harmonic converts to X-mode at the UHR and then O-mode • Emission elliptically polarized due to oblique view of plasma • EBW coupling efficiency less sensitive to Ln than B-X conversion n2 EBW >>1 1 X-mode O-mode fpe, fL fUHR R B-X-O transmission window • B-X-O transmission angle depends on field pitch (~30-45º) at MC layer • Ln at MC layer determines width of window • Measured Trad = local Te provided CB-X-O ~ 100% f=16 GHz Ln~3 cm 90%
Remotely steered EBE diagnostic allows spatial mapping of emission window Beam waist • ±10º scan in poloidal and toroidal directions between discharges • Acceptance angle: • 8-18 GHz antenna ~22º • 18-40 GHz antenna ~14º Ln~3 cm Ln~7 cm Antenna spatial scan region S.J. Diem, et al, Rev. Sci. Instrum. 77 (2006)
Linear actuators allow ± 10° poloidal and toroidal steering • Two drives provide motion in poloidal & toroidal direction • Spherical housing provides steering • Antennas located outside vacuum vessel • Quad-ridged antennas measure two orthogonally polarized radiation components • Dividing the components yields polarization • Adding components yields total power • Remote steering allows for optimization of B-X-O transmission efficiency • Needed for robust Te(R,t) measurements 18-40 GHz EBW Antenna
Emission location determined by EBE simulation code • Code inputs: • Magnetic equilibria (EFIT) • Te & ne profiles from Thomson scattering • Antenna pattern measurements • CB-X-O is determined by the full wave solution for a cold plasma slab • Provides method to compute CB-X-O so that Te profile can be reconstructed Te(R) = Trad(R) / CB-X-O • 3D ray-tracing code describes EBW propagation after MC • Trad determined by simultaneously solving ray equations with the radiative transfer equation for each ray J. Urban & J. Preinhaelter, Journal of Plasma Physics, 72 (2006)
Observed large Trad fluctuations predominately due to changes in B-X-O transmission efficiency • Trad fluctuates > 30% for all frequencies • Microwave edge reflectometer used to measure ne profile • Measured Ln fluctuates from 1 cm to 6 cm • Theoretical CB-X-O computed using measured Ln values • Varies as ~ • Fluctuation levels of Trad (30%) and CB-X-O (20%) comparable Maximum Trad used to calculate measured CB-X-O
Initial H-mode EBE measurements exhibited decay in measured Trad during H-mode phase • Emission decays after L-H transition • Observed for fce, 2fce and 3fce emission • Emission location remains constant during discharge • Leads to CB-X-O ~ 0% during H-mode • Low emission levels prohibit Te(R,t) measurements • EBW collisional damping suggested as explanation of measured Trad evolution • Damping becomes significant for Te < 30 eV at or inside the UHR layer
EBE simulations suggest low H-mode EBE due to EBW collisional damping • MC layer moves outside LCFS after L-H transition • Te < 20 eV outside LCFS • EBE simulations with collisional damping predict Trad decay during H-mode • Relative collision frequency increases after L-H transition: • Peak eiincreases from 5x10⁻⁵ to 1.2x10⁻⁴ • Damped EBW power increases from 20-40% in the L-mode phase to 70-90% during H-mode With collisions Need method to reduce edge collisionality Li conditioning
LIThium EvaporatoR (LITER) provides edge conditioning tool for NSTX • Improvement in edge ne and Te with LITER may be important for B-X-O coupling • Coupling depends on Ln and Te • Li conditioning: • Increases Te at MC layer • Decreases ne outside LCFS • Reduction in edge ne moves MC layer to LCFS where Te ~ 20 eV 0 mg/min Li LCFS LCFS 19 mg/min Li RMC RMC RMC RMC
H-mode CB-X-O increased with Li edge conditioning • Measured Trad increased from ~ 50 eV to ~ 400 eV • 18 GHz emission from near plasma axis • CB-X-O increased with Li conditioning: • From 10% 60% for fce=18 GHz • From 20% 50% for 2fce=28 GHz • Control of edge conditions provides good coupling to EBW f = 18 GHz Increased B-X-O coupling allows for more robust conditions for Te(R,t) measurements 11
Angle of maximum B-X-O transmission consistent with theory in H-mode plasmas • Repeated target plasma, (Ip =0.9 MA, Te(0)~1keV) with Li conditioning • Maximum measured CB-X-O: • 62±15% for fce=18 GHz near axis emission • 49±15% for 2fce=28 GHz near axis emission • Measured and predicted angle of peak emission consistent in L-mode as well Predicted CB-X-O
Trad maximum at Zaxis ~ 0, in agreement with simulations • Target H-mode plasma: Ip=0.8 MA, Te(0)=0.8 keV, ne(0)=3x10¹⁹ m-3 • Vertical position scanned from -2 to 11 cm • Drop in measured Trad coincides with increase in Zaxis • Measured and simulated Trad agree during Zaxis scan 2fce=28 GHz Measured Sim. 13
EBE simulation of Zaxis scan suggests increase in Doppler broadening • Prior to Zaxis increase, emission originates near axis (R=1 m) • At maximum Zaxis, Remission shifts out to R=1.4 m • Simulations show increase N|| with Zaxis • Leads to increase in Doppler broadening Doppler broadening restricts access to core Te measurements
Lithium edge conditioning provides good target H-mode plasma for Te(R,t) measurements • Lithium edge conditioning reduced collisional losses to < 20% • EBE simulation calculates CB-X-O and ray emission location • Code accounts for losses due to re-absorption, re-emission & collisional damping • Emission location determined by weighted-average emission location of the simulated 41 rays • Te from EBE diagnostic computed by: • Edge EBE simulations more accurate because rays travel through less plasmas Thomson Scattering
Non-localization of Te(R) measurements from EBE diagnostic due to multi-harmonic emission • Harmonic overlap in ST occurs from high toroidicity • Accurate simulations very important • Finite size of beam can lead to non-localized measurements • Spread in emission location due to Doppler broadening • Diagnostic sensitive to emission from multiple harmonics • Need detailed edge measurements to accurately model EBE process Radiometer range 16
EBE based Te(R,t) measurements in the ST are challenging • Local Te equal to Trad from EBE measurements provided CB-X-O ~ 100% • Coincidence of X- and O-mode cutoffs required for CB-X-O = 100% • Reconstruction of Te(R) profile is difficult in the ST • Rapid fluctuations in edge Ln lead to > 20% fluctuations in CB-X-O • EBW collisional damping in H-mode can quench low harmonic EBE • Non-optimal plasma vertical position restricts core Te(R) measurements • Requires knowledge of actual magnetic configuration which is strongly varied by large internal currents • Te(R) reconstruction of NSTX H-mode plasma shows agreement with edge Te from Thomson • Larger disagreement with central Te occurs where Doppler broadening and harmonic overlap effects are increased
Lens optimization provides minimal beam waist • 8-18 GHz antenna • 20 cm focal length lens provides beam waist of 10 cm at plasma edge (50 cm in front of the antenna) for 16.5 GHz • Focal length ~10 cm for microwaves • 18-40 GHz antenna • 25 cm focal length lens provides beam waist of 6.5 cm at plasma edge for 28 GHz • Focal length ~12.5 cm for microwaves Allows for localized measurements
Dicke switching method provides absolute calibration • Antenna assembly viewed blackbody source (LN2 cooled Eccosorb) through chopper wheel • Blackbody emission signal from antenna fed into radiometer tuned to a particular frequency • Radiometer yields an output voltage proportional to input intensity • Vout=G(f)Trad • G(f) is a frequency dependent gain factor (V/eV) • All vacuum windows, lenses, antennas, and cables used in the experiment included in calibrations
Antenna steering scan provides good coverage of B-X-O window • Repeated target helium L-mode plasma (Ip=0.8 MA, Te(0)=1.5 keV, ne(0)=3x10¹⁹ m-3) • Moved EBE antennas to new position between shots • Experimental B-X-O transmission efficiency: • Maximum measured transmission efficiencies: • 90% for fce=15.5 GHz • 40% for 2fce=25 GHz • Predicted transmission only accurate for MC layer; EBWs may be re-absorbed and re-emitted before MC He L-mode 2fce=25 GHz fce=15.5 GHz Predicted B-X-O transmission efficiency
EBE simulations indicate increase in ei near MC results in significant loss in ray intensity • High emission (t <0.2 s): • ei~ 3x10⁻⁵ • Ray intensity decreased by 40% in edge • Low emission (t >0.2 s): • ei~ 1.2x10⁻⁴ • Ray intensity decreased by 80% in edge Edge Li conditioning may reduce edge collisionality
Better Trad agreement with EBE simulation in 19 mg/min Li conditioned plasma Trad (measured) Trad (sim., no collisions) Trad (sim., with collisions) • For highest Li evaporation rate, 19 mg/min: • Measured Trad~0.4 keV • Simulated Trad~0.6 keV • For 0 mg/min: • Measured Trad~0.1 keV • Simulated Trad ~0.4 keV 19 mg/min fce=18 GHz fce=18 GHz 0 mg/min Control of edge conditions allows for good coupling to EBW
Good agreement between measured and simulated Trad in H-mode Trad (measured) Trad (sim., no collisions) Trad (sim., with collisions) • Simulated & measured Trad • 0.6 keV for fce=18 GHz • 0.4 keV for 2fce=28 GHz • Low EBW collisional damping observed during H-mode scan fce=18 GHz 2fce=28 GHz 31 31