Download
1 / 43
430 likes | 574 Views
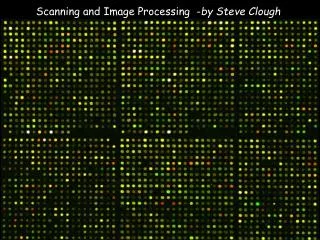
Scanning and Image Processing - by Steve Clough. cDNA microarrays use two dyes with well separated emission spectra such as Cy3 and Cy5 to allow direct comparisons on single slide. GSI Lumonics. Ratio of Expression of Genes from Two Sources. higher in B. equal. higher in A.

E N D
cDNA microarrays use two dyes with well separated emission spectra such as Cy3 and Cy5 to allow direct comparisons on single slide GSI Lumonics
Ratio of Expression of Genes from Two Sources higher in B equal higher in A Cells from condition A Cells from condition B mRNA Label Dye 1 Label Dye 2 cDNA
1 16 2 2 False Coloring of Fluorescent Signal Scale of increasing fluorescent intensities 2 65,536 Stronger signal (16 bit image) Steve Clough, USDA-ARS University of Illinois, Urbana
Cy3 Scan Cy5 Scan Overlay
After double clicking the ScanArray icon on the desktop, the following window will appear. Click on the Laser 1 and Laser 2 tabs to turn on the lasers.
After lasers have warmed up, the laser tabs turn green. Click on the ‘Configure’ button on the left.
Click on ‘Scan Protocols’ to select a protocol to use for Quick Scanning. The purpose of Quick Scanning is to determine the correct laser levels needed to have balanced intensities between Cy3 and Cy5 channels and to find levels that provide a nice spread of intensities across the spectrum without having too many saturated spots. Note: the scans do not have to be perfectly balanced between the 2 dyes as a mathematical correction called ‘normalizing’ or ‘smoothing’ will be performed later. However, having the scan levels approximately balanced will minimize the magnitude of the normalization correction factor.
In this example we are using one of the Vodkin soybean 9k arrays such as 1021/83, 1070, or 1088. To begin the Quick Scanning process, highlight the ‘9K QUICK’ protocol and click ‘Change’
These are default settings. Verify that nobody has changed them and click ‘Next’.
The quick scan will only cover a small portion of the slide as this reduces the likelihood of bleaching the dyes and you only need a small sampling to determine if the colors are balanced. Verify only this top section is selected and then click ‘Next’.
For our scanner, we found that using a default of: Cy3: 80 PMT and 70 Laser Cy5: 70 PMT and 70 Laser works well as an initial starting point for scanning. Change values as needed by highlighting the dye that needs changing and clicking ‘Change’
Enter new values And click ‘OK’
Highlight the two dyes and then click on the ‘Copy Current Area to all Fluorophores’ to set the scan areas.
These are default settings. Verify that nobody has changed them and click ‘Next’.
The settings should be as they appear below. Be sure resolution is set at 50 um or else you’re more likely to bleach dyes. Click ‘Start’
When run ends, click ‘Finish’ to view the results and determine what adjustments will need to be made to balance the signals between the two dye channels.
In this example, the composite Cy3_Cy5 image is too green indicating that the overall fluorescence level of Cy3 labelling was much stronger than Cy5. Therefore, we need to either adjust the Cy3 down or the Cy5 up to balance them.
Clicking on the ‘Cyanine 3 (Control)’ tab shows the intensity related to the Cy3 label. Check to determine the level of saturation. We believe that about 1-3 saturated spots per subgrid is a good level. To see the spots more clearly, click the ‘Zoom In’ tab.
Close up of a sub grid shows that we are in this range of having about 1-3 saturated spots per subgrid. Therefore, we’ll keep this Cy3 setting and adjust the Cy5. Click the Cyanine 5 (Source) tab to see the Cy5 levels.
Clicking on the ‘Cyanine 5 (Source)’ tab shows the intensity related to the Cy5 label. In this example, the levels are low with none approaching saturation. We will need to increase the Cy5 laser and/or PMT levels to be closer to that of the Cy3 levels. It takes some experience to determine how much to adjust (and this may vary with machine). Here we will try adjusting laser up 10 and PMT up 15 points.
To change Cy5 value: Go back to Step 3, 4, 5, 6. Change Cy5 values as needed by highlighting Cyanine 5 and clicking ‘Change’. Based on the first quick scan we decided to change the Cy5 to 85 PMT and 80 laser and to leave Cy3 at 80 PMT and 70 Laser
Repeating the quick scan with these new values for Cy5 produced an image with good balance between the two dyes as most spots look yellow with a fairly similar number of reddish and greenish spots. Can click on the ‘Zoom In’ tab to have a better view. .
Use the ‘Zoom In’ tab to get better picture of a given subgrid.
Now that the Quick Scans has given us an acceptable balance between Cy3 and Cy5 images, we need to do a ‘real’ scan at higher resolution at these same laser and PMT levels. Go back to the ‘Configure’ tab and click on the ‘Scan Protocols’
Change on the appropriate real scan protocol. This example uses one of the 9K slides (ex: Gm-1021/83, Gm-r1070 or Gm-r1088) so highlight the ‘9K Real Scan’ and hit the ‘Change’ tab.
Verify that these default settings are in place and click ‘Next’.
Verify that the default area is set correctly and click ‘Next’.
Change the PMT and Laser settings to use levels determined from Quick Scans. In this example the Quick Scans suggested Cy3: 80 PMT and 70 Laser, Cy5: 85 PMT and 80 Laser.
Highlight both dyes and click on ‘Copy Current Area to all Fluorophores’. Then click ‘Next’.
Click ‘Close’ tab as you have finished setting the scan parameters and are now ready to scan.
Select 9K REAL SCAN. Verify that the default scan area has not been changed and click ‘Start”
The scanner will scan the slide with both the Cy3 and Cy5 lasers and show the composite image, which should be mostly yellowish if the dyes are fairly balanced. The image looks better if click the ‘3x3 median’ tab which averages pixels based on neighboring pixel values.
Image after applying the ‘3x3 Filter’. Note that most spots are fairly yellow and that there are not too many saturated spots (no more than 2-3 per subgrid).
To save the images, you need to save the individual Cy3 and Cy5 scans. Click the ‘Cyanine 3 (Control)’ tab and then click the ‘File’ tab to pop up the File Options window.
Identify your folder and type in the file name. To make it easier, you can click on the name of a previous slide and that name will pop into the ‘File name’ box and you can modify it. The naming convention we use is to follow slide name with channel (1 for Cy3, 2 for Cy5), and than SB followed by the scan for this slide (SB01 for first scan and SB02 for second, etc if one decides they do not like the scan and wish to repeat it). Save every scan as there is always a chance that the next scan will be worse as dyes might begin to fade after repeated scanning.