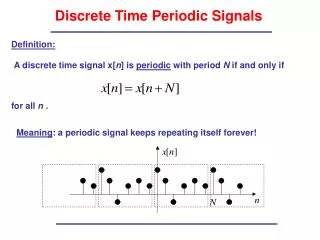
Periodic signals
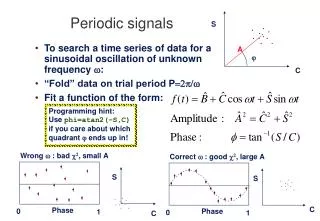
S. A. . C. Wrong : bad , small A. S. C. Phase. 0. 1. Periodic signals. To search a time series of data for a sinusoidal oscillation of unknown frequency : “Fold” data on trial period P Fit a function of the form:. Programming hint: Use phi=atan2(–S,C)

Periodic signals
E N D
Presentation Transcript
S A C Wrong : bad , small A S C Phase 0 1 Periodic signals • To search a time series of data for a sinusoidal oscillation of unknown frequency : • “Fold” data on trial period P • Fit a function of the form: Programming hint: Use phi=atan2(–S,C) if you care about which quadrant ends up in! Correct : good , large A S Phase 0 1 C
S S C C Periodograms • Repeat for a large number of values • Plot A() vs to get a periodogram: A()
Fitting a sinusoid to data • Data: ti, xi ± i, i=1,...N • Model: • Parameters: X0, C, S, • Model is linear in X0, C, S and nonlinear in • Use an iterative fit to linear parameters at a sequence of fixed trial .
Iterate to convergence: • Error bars:
Periodogram of a finite data train • Purely sinusoidal time variation sampled at N regularly spaced time intervals t: • The periodogram looks like this: • Note sidelobes and finite width of peak. • Why don’t we get a delta function?
Spectral leakage • A pure sinusoid at frequency “leaks” into adjacent frequencies due to finite duration of data train. • For the special case of evenly spaced data at times ti = it, i=1,..N with equal error bars: • Hence define Nyquist frequency fN = 1/(2Nt) A() Note evenly spaced zeroes at frequency step = 2f = 2/Nt = 2fN/(N/2) x
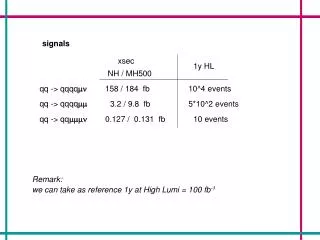
Two different frequencies • Sum of two sinusoidswith different frequencies, amplitudes, phases: • Periodogram of this data train shows two superposed peaks: • (This is how Marcy et al separated out the signals from the 3 planets in the upsilon And system)
Closely spaced frequencies • Wave trains drift in and out of phase. • Constructive and destructive interference produces “beating” in the light curve. • Beat frequency B = |1 - 2| • Peaks overlap in periodogram.
Prewhitening • Can separate closely-spaced frequencies using pre-whitening : • Solution yields X0, 1 , 2 , A1 , A2 , 12
Data gaps and aliasing Gap of length Tgap • How many cycles elapsed between two segments of data? • Cycle-count ambiguity • Periodogram has sidelobes spaced by • Sidelobes appear within a broader envelope determined by how well the period is defined by the fit to individual continuous segments.
Non-sinusoidal waveforms • Harmonics at = k 0, k = 1, ... modify waveform. • Fit by including amplitudes for : • sin 2t, cos 2t • sin 3t, cos 3t • etc • The different sinusoids are orthogonal. • Can fit any periodic function this way.
Sawtooth Square wave