Download
1 / 14
140 likes | 260 Views
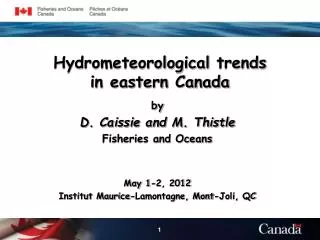
This study investigates hydrometeorological trends in Eastern Canada, focusing on mean annual and seasonal air temperatures, total annual precipitation, streamflow dynamics, and river ice conditions. Utilizing data from Environment Canada, including Adjusted and Homogenized Canadian Climate Data (AHCCD) and HYDAT, the analysis spans from 1950 to 2010. Key findings include substantial increases in summer and autumn temperatures, while winter temperatures showed no significant change. Precipitation trends reveal variability without distinct seasonal patterns. This research provides insight into long-term environmental changes in the region.

E N D
Hydrometeorologicaltrends in eastern Canada by D. Caissie and M. Thistle Fisheries and Oceans May 1-2, 2012 Institut Maurice-Lamontagne, Mont-Joli, QC
Introduction • Mean annual & seasonal air temperatures • Data from Envrionment Canada (Adjusted and Homogenized Canadian Climate Data - AHCCD) • Annual & seasonal total precipitation • Data was also from AHCCD • Streamflow trend analysis • Peak and low flows (as defined by a 30-day mean) • Timing of peak and low flows • Ice conditions in rivers • Data from Environment Canada (HYDAT & CEHQ)
Site Selection Criteria • Spatial distribution • Duration of record • Data quality • Close proximity of sites (e.g., AirT, P and Q)
Selected Sites Air temperature (37) Total Precipitation (35) Rivers (42)
Change in Annual Mean Temperature (oC/decade) > 1.0 0.6 – 1.0 0.3 – 0.6 0.0 – 0.3 No significant change Annual Air Temperature (60 & 30 years) 0.6-1.0°C 68% (25/37) 70% (26/37) 0.0-0.3°C A) 1951 - 2010 B) 1981 - 2010
Annual Air Temperature (1900-2010) Change in Annual Mean Temperature 1900-2010 (oC/decade) 0.3 – 0.6°C 0.09 – 0.3°C < 0.09°C No significant change 87% (20/23) 0.09-0.3°C
Change in Seasonal Mean Temperature 1951-2010 (oC/decade) > 1.0 0.6 - 1.0 0.3 – 0.6 0.0 – 0.3 No significant change B) Spring A) Winter A) Winter D) Autumn C) Summer C) Summer Air Temperature (1951-2010) Seasonal 27% (10/37) 14% (5/37) 54% (20/37) 87% (32/37)
Air Temperature • The level of increase in annual AirT is greater in last 30 years (1981-2010) due to a cold period in late 80s and early 90s • On a seasonal basis, summer and autumn AirT showed more wide spread increases for both the 30 & 60 years period • Winter mean temperature did not significantly increased in 1951-2010; however did in 1900-2010
Change in Total Annual Precipitation (percent change/decade) > 10 5 - 10 0 - 5 No significant change Total Precipitation (60 & 30 years) 29% (10/35) No clear seasonal pattern was observed A) 1951 - 2010 B) 1981 - 2010
Change in Annual Average Flow (percent change/decade) >>10 >10 5 - 10 0 - 5 No significant change Mean Annual Flow (60 & 30 years) A) 1950 - 2009 B) 1980 - 2009
Change in Seasonal Flow Extremes (percent change/decade) >>10% >10 5 - 10 0 - 5 No significant change Trends in Magnitude (1950-2009) 26% (11/42) 19% (8/42) Spring Maximum – 1950 - 2009 Summer Minimum – 1950 - 2009
Change in Timing of Seasonal Flow Extremes (days/decade) 6 - 9 3 - 6 0 - 3 No significant change Trends in Timing (1950-2009) 42% (14/42) Spring Maximum – 1950 - 2009 Summer Minimum – 1950 - 2009
Change in Annual Ice Days (days/decade) >>10 >10 5 - 10 0 - 5 No significant change Trends in Ice cover (1950-2009)
Thank you ! Questions !


![2006 Executive Council Input [Eastern Canada Chapter]](https://cdn3.slideserve.com/5652274/2006-executive-council-input-eastern-canada-chapter-dt.jpg)