Comparison of Methylated Genes in PCNSL and DLBCL
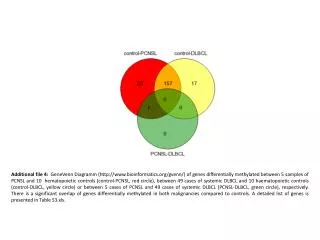
GeneVenn diagram illustrating methylated gene overlap between PCNSL, systemic DLBCL, and hematopoietic controls. Explore genes differentially methylated across malignancies. Detailed gene list in Table S3.xls.

Comparison of Methylated Genes in PCNSL and DLBCL
E N D
Presentation Transcript
Additional file 4: GeneVenn Diagramm (http://www.bioinformatics.org/gvenn/) of genes differentially methylated between 5 samples of PCNSL and 10 hematopoietic controls (control-PCNSL, red circle), between 49 cases of systemic DLBCL and 10 haematopoietic controls (control-DLBCL, yellow circle) or between 5 cases of PCNSL and 49 cases of systemic DLBCL (PCNSL-DLBCL, green circle), respectively. There is a significant overlap of genes differentially methylated in both malignancies compared to controls. A detailed list of genes is presented in Table S3.xls.