Download
1 / 33
330 likes | 356 Views
Learn to interpret and excel in reading various complex charts. Understand color codes, line meanings, and trends in pie charts and more. Ideal for enhancing graph skills.

E N D
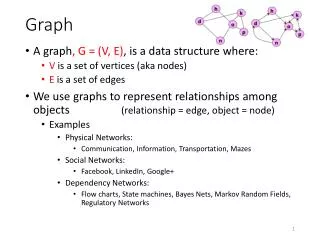
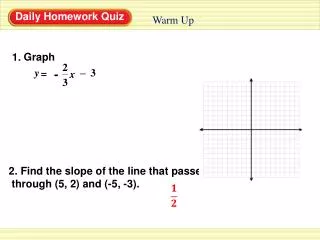
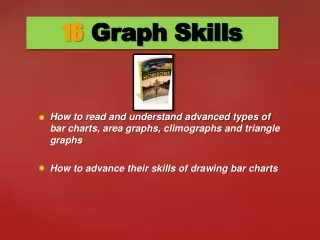
16 Graph Skills How to read and understand advanced types of bar charts, area graphs, climographs and triangle graphs How to advance their skills of drawing bar charts
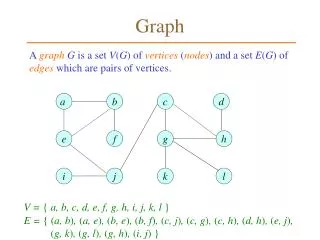
What do the colours represent? What does the red line represent? How do you ‘interpret’ these charts?
Triangle graphs 100 0 0 100 0 100 0 100 100 0 3 numbers always add up to 100% 0 100
Drawing bar charts • Simplest form of displaying statistical information • Best method to use in the exams Chapter 16: Graph Skills
The following steps should be taken to construct a bar chart: • Always draw a bar chart on graph paper with a ruler • The bar chart should be given a title from the information provided • The X-axis and the Y-axis should be labelled • If the Y-axis is numbered then have equal intervals between the values, for example 10, 20, 30, etc. not 10, 25, 42, 50, etc. • The bars on the bar chart should also be of equal width and colour coded if time allows. Chapter 16: Graph Skills
Marking scheme for bar charts is as follows: • Title: 2 marks • Graph paper: 2 marks • Scaled axis: 2 x 2, 4 marks in total • Information plotted: 2 x 6, 12 marks in total Chapter 16: Graph Skills