Download
1 / 14
140 likes | 350 Views
Measurement in Medicine. Lord Kelvin. When you can measure what you are speaking about, and express it in numbers, you know some

E N D
Lord Kelvin • When you can measure what you are speaking about, and express it in numbers, you know some • thing about it; but when you cannot express it in numbers, your knowledge is of a meagre and unsatisfactory kind; but you have scarcely, advanced to the stage of science.
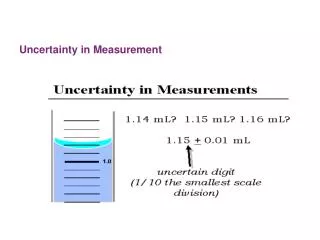
Measurement Measurement of data describe the phenomenon in a form that can be analysed statistically. The validity of a study depends on how well the variables in a study represent the truth e.g. how well does fasting blood sugar represent the status of diabetes. Variable“that varies” ;Q. what do you call a data that does not vary? Data can be classified in two categories continuous and categorical. Continuous variable- (show tape)Here measurement is made on a continuum, the difference between two possible data values can be very small. The data can take fractional values (10.5).
“ A false balance is an abomination to the Lord, but a just weight is a delight” Proverbs 11:1 • S.S. Stevens classified measurements into nominal, ordinal, interval and ratio
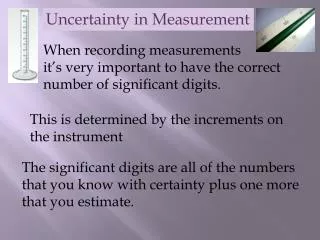
This is most accurate form of measurement.. The variable can take any conceivable value within the observed range. Continuous data are rich in information and can be analyzed with powerful statistical test. The continuous data is of two types- Ratio scale and Interval scale Ratio scale- Measurement scale having a constant interval size and a true zero are called ratio scale e.g. length of time(hour,year), height, weight, Kelvin temperature, volume and rate.It can be said that a boy with height of 2 ‘ is twice as tall, as a boy of one foot. Interval Scale-There is no true zero, otherwise it is similar to ratio scale e.g. Celsius, IQ. The temperature of 40 0C is not twice as hot as temperature of 20 0C. The statistical test and method of analysis for both ratio and interval scales are similar.
Categorical variable- Here quantification of the variable is not possible e.g. gender, race, grade of a cancer, degree of pain and counts of patients. It is of two types nominal and ordinal.Nominal scale- Here there is no order (nominal in latin means name) e.g. M/F, Hindu/muslim and alive or dead. Ordinal scale- Ordinal data have the values arranged in ranks or orders (ordinal in Latin means order) e.g.Pain- mild moderate, severe; Spleen- small, medium or large, Student’s grade-ABC. It has less information than interval or ratio scale because exact measurement of a phenomena is not possible.The grading is subjective and requires human judgment hence susceptible to error.
Ordinary variable- We cannot say that person of grade C is half as good as of grade A, therefore comparison between the grades is not possible. The analysis needs special tests, but with 5 or more categories (pain score of 0 to 10) it can be treated as continuous variable for analysis.
Type of Measurement Characteristics Of variable Example Appropriate Statistics Information content and power Categorical Nominal Unordered Sex, blood type, race Counts, proportions ,RR, χ2, Mantel-Haentzel, logistic regression Low Ordinal Ordered intervals that are not quantifiable Cancer grade +, ++, +++ In addition to the above; median, log linear , rank correlation Intermediate Continuous or ordered discrete Ranked spectrum with quantifiable intervals Weight; BP,IQ, Blood sugar, size of tumour In addition to the above: mean, standard deviation, t-test, analysis of variance, more powerful regression High
Strategy to reduce random error Source of random error Example of random error Example of strategy to prevent the error 1. Standardizing the measurement methods in an operations manual Observer Subject Variation in blood pressure (BP) measurement due to variable rate of cuff deflation(sometimes faster than 2mm Hg/second and sometimes slower) Variation in BP due to variable length of quiet sitting Specify that the cuff be deflated at 2mm Hg/sec Specify that subject sit in a quiet room for 5 minutes before BP measurement 2. Training and certifying the observer Observer Variation in BP due to variable observer technique Train observer in standard techniques 3. Refining the instrument Instrument or observer Variation in BP due to digit preference (e.g., the tendency to round numbers to a multiple of 5) Use zero muddler to conceal BP reading until after it has been recorded 4. Automating the instrument Observer Variation in BP due to variable observer technique Use electronic BP measuring device 5. Repeating the measurement Observer, subject, and instrument All measurements and all sources of variation Use mean of three or more BP measurements
Precision Accuracy Definition The degree to which a variable has nearly the same value when measured several times The degree to which a variable actually represents what it is supposed to represent Best way to assess Comparison among repeated measures Comparison with a gold standard- chest finding-JNP, ECG-KSR Value to study Threatened by Increase power to detect effects Random error (variance) Contributed by: The observer The subject The instrument Increase validity of conclusions Systematic error(bias) Contributed by: The observer The subject The instrument
Psychometric Measurement Scales • Collection of items intended to reveal levels of theoretical intangible phenomena • Items intend to capture a construct which is an intangible latent variable e.g. Likert scale
Summary • The measurement should be- Recto vaginal fistula Reliable Valid Feasible