Download
1 / 1
10 likes | 73 Views
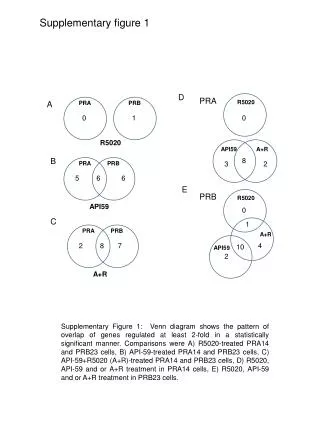
Supplementary Figure 1: Venn diagram displays gene overlap patterns for R5020, API-59, and combined treatments in PRA14 and PRB23 cells, showing statistically significant changes. Explore gene regulation effects in different hormonal treatment scenarios.

E N D
Supplementary figure 1 D PRA R5020 A PRA PRB 0 1 0 R5020 API59 A+R B 8 PRA PRB 3 2 5 6 6 E PRB R5020 API59 0 C 1 PRA PRB A+R 2 8 7 4 10 API59 2 A+R Supplementary Figure 1: Venn diagram shows the pattern of overlap of genes regulated at least 2-fold in a statistically significant manner. Comparisons were A) R5020-treated PRA14 and PRB23 cells, B) API-59-treated PRA14 and PRB23 cells, C) API-59+R5020 (A+R)-treated PRA14 and PRB23 cells, D) R5020, API-59 and or A+R treatment in PRA14 cells, E) R5020, API-59 and or A+R treatment in PRB23 cells.


