Download
1 / 23
230 likes | 235 Views
Explore the major opportunities and challenges facing Western Australia's resources sector, including its impact on the state economy, export destinations, new projects, and the demand for labor and infrastructure.

E N D
The Chamber of Minerals and Energy of Western AustraliaThe WA Resources Sector - Opportunities and Challenges Presented by Reg Howard-Smith Chief Executive NATSTATS2010 Conference 16 September 2010
The WA Resources Sector Major driver of the state economy: • $70.9billion in production value • (Growth of 14% per annum over last decade) • 89% of the State’s merchandise export income • $3.2billion in State royalties • 77,000 people directly employed in mining + petroleum • Mining component of WA GSP: 27% Base Metals 2% Heavy Mineral Sands 1% Alumina 5% Nickel 6% Iron Ore 48% Gold 9% Petroleum (including LNG) 27% Source: Department of Mines and Petroleum Value of WA’s Minerals and Petroleum Industry 2009-10 WA Department of Treasury and Finance, State Budget 2009/10 www.cmewa.com
Western Australian Resources - National Significance • Last year, the WA resources sector accounted for: • 48% of Australia’s total value of mineral and petroleum sales • 65% of Australia’s oil and condensate production • 75% of Australia’s gas production • 55% of Australia’s mineral exploration expenditure • 76% of Australia’s petroleum exploration expenditure • 61% of total national mining investment Source: Department of Minerals and Petroleum website; October 2009 Source: WA Department of Mines and Petroleum Statistics Digest 2008-09 www.cmewa.com
Export Destinations for WA Resources Iron ore exports Petroleum exports Source: Department of Mines and Petroleum – Statistics Digest 2008-09 www.cmewa.com
Export Destinations for WA Resources Gold exports Alumina exports Source: Department of Mines and Petroleum – Statistics Digest 2008-09 www.cmewa.com
Export Destinations for WA Resources Nickel exports Mineral Sands exports Source: Department of Mines and Petroleum – Statistics Digest 2008-09 www.cmewa.com
Urbanisation in China China is likely to develop 20 major economic zones involving 358 cities (11 >15m, 18 > 10m people) Source: MCA OZMine (Indonesia) presentation, data fromRio Tinto, BHP Biliton, NDRC, January 2008 www.cmewa.com
India’s Change in Middle Class Household Incomes Source: MCA OZMine (Indonesia) presentation www.cmewa.com
New Resource Projects in Western Australia Gas & LNG: 8 projects -$114b Iron ore: 16 projects - $37b Processing: 3 projects -$7b Port/rail/water 2 projects - $5b Oil: 3 projects - $4b Other minerals: 3 projects - $3b Power: 3 projects - $2b TOTAL: $172b Source: Department of State Development, April 2010 16/09/2010 www.cmewa.com
Major Project Timeline www.cmewa.com
Committed Projects Cossack/Wanaea Oil&Gas - $1.8b North Rankin LNG - $5b Pluto LNG - $12b Brockman Syncline 4 Iron Ore - $2b Gorgon LNG - $43b Rapid Growth 5 Iron Ore - $5.3b Sino/Citic Iron Ore - $5.2b Mesa A/Warramboo Iron Ore - $1.2b Karara Iron Ore - $1.8b Worsley Alumina - $2.5b Source: DMP Prospect Magazine 2010 13/09/2010 www.cmewa.com
Under Consideration Browse LNG Precinct - $30b Wheatstone LNG - $3b Various Pilbara Iron Ore Projects - $14.5b Macedon Oil & Gas - $1b Spinifex Ridge Molybolenum/Copper - $1b Mid-West Iron Ore Projects - $2.26b Yeelirrie Uranium $TBA Tropicana Gold - $700m Oakajee Port and Rail - $4b Coal to Urea Fertiliser Plant - $3.5b Source: DMP Prospect Magazine 2010 Southdown Magnetite - $1.6b 13/09/2010 www.cmewa.com
Source: Planning for Resources Growth in the Pilbara: Revised Employment and Population Projections to 2020, Pilbara Industry’s Community Council April 2010 Demand for Labour www.cmewa.com • National Resources Sector Employment Taskforce Report released. • Population and immigration prominent issues in Federal Election campaign. • Looming demand for labour must not be lost in the debate. • Significant labour shortages during the last expansion • Approximately 60% of job vacancies in trades essential for constructing and operating resources projects • Latest employment projections for Pilbara substantially higher than pre-GFC trajectory*
Absolute growth and historical scenarios Source: ACIL Tasman analysis based on TIAC, CCIWA, Access Economics, and ABS Catalogue 3101 data Demand for Labour www.cmewa.com
Origin of FIFO workers in 2008 Source: District Survey Data with extrapolated growth, GEM Consulting Analysis (Chamber of Minerals and Energy, 2008) Demand for Labour • Factors affecting labour availability • Low unemployment rate • Ageing population • Supply of community infrastructure • Fly in-fly out patterns • Population growth critical www.cmewa.com
Population flows by type, Western Australia, by quarter 1999 to 2009 Source: ABS Catalogue 3101.0 Table 4 www.cmewa.com Demand for Labour Immigration critical for population growth
Summary of infrastructure adequacy, by region Potential distribution/supply issues may exist Note: Trend is assessed by evaluating the impact of projects (committed or under construction) on each region Demand for Infrastructure www.cmewa.com
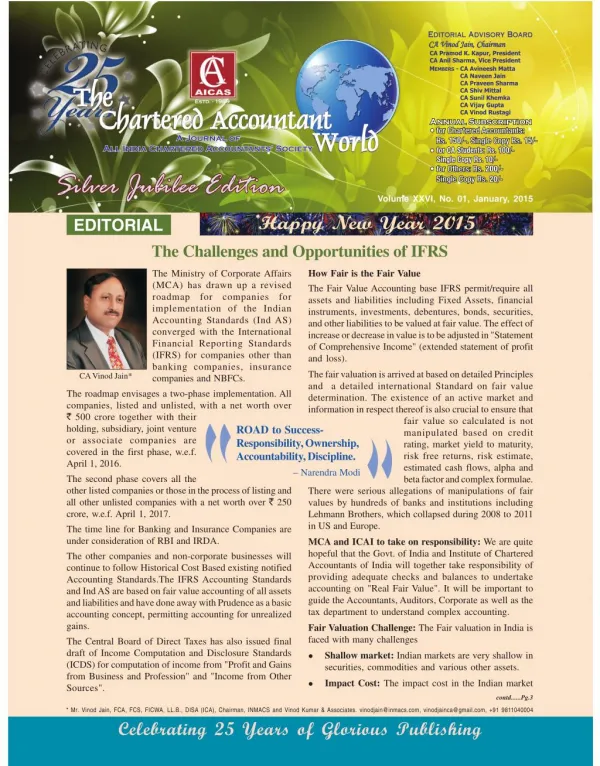
Source: Foreign Investment Review Board Annual Report 20089, Table 2.4: Total approvals by industry sector in 2008-09;ABS: 53520 - International Investment Position, Australia: Supplementary Statistics, 2008 - Table 15a. Foreign Investment in Australia(a): Level of Investment at 31 December 2008 by Industry Division (ANZSIC), Direct Investment in Australia Need for Foreign Investment The Australian resources industry is heavily driven by foreign investment in the exploration, development and production stages. The Foreign Investment Review Board’s 2009 Annual Report showed there were $90.6 billion of approvals of proposed investments in mineral exploration and development ($64.3 billion in 2007-08) Mining, above all other industries, relies on foreign investment. In 2008, direct foreign investment in the mining industry was ~ $100 billion. The USA, UK and Japan are the biggest investors in Australia (all industries). 1. Foreign Investment Review Board Annual Report 20089, Table 2.4: Total approvals by industry sector in 2008-09 www.cmewa.com
Resources Rent Tax www.cmewa.com CME has always maintained a strong preference for retention of the current state regime, administered by the state government with revenues flowing to the state. Notwithstanding, CME has supported genuine reform of the Australian taxation system and argued, in relation to any consideration of a federal tax on resources, that it should: • be prospective, that is, apply to only new investment • protect Australia’s international competitiveness • be differentiated by resource commodities • be levied on primary resource value While CME welcomes the removal of the Resources Super Profits Tax (RSPT) and acknowledges the progress under the proposed Minerals Resource Rent Tax (MRRT), there still exists a number of fundamental issues, key amongst them the impact on Australia's international competitiveness.
Calculated as follows: MRRT rate of 30% less the extraction allowance of 25% = MRRT effective tax rate of 22.5%. Plus corporate tax of 30% less deduction for MRRT paid = total effect tax rate of 45.75%. Applying to pre-mine gate activities and assuming no starting base deductions of uplift at LTBR + 7% • Source: Minerals Council of Australia, www.keepmining.com.au (no longer available), with reference to Citigroup Mining and Metals Research. Research Note 2 may 2010. Note these effective rates are not specific to iron ore or coal production. International Competitiveness Under the MRRT, the ~45%overall1 effective tax rate will make Australia one of the highest taxed mining jurisdictions in the world for iron ore and coal. www.cmewa.com
Source: The Fraser Institute Survey of Mining Companies: 2010 Mid-year Update was sent to approximately 3,000 exploration, development, and other mining-related companies around the world. The survey, conducted from June 1 to June 30, represents responses from 429 of those companies; 51 jurisdictions were ranked. Australia’s Competitiveness www.cmewa.com • Resource Rent Taxes, introduced without consultation, have a significant impact on a jurisdiction’s attractiveness to investment. • The Fraser Institute’s 2010 mid-year mining survey, taken while the RSPT was still on the table, showed the following with respect to exploration investment attractiveness: • The average score of the Australian states declined from 62.9 out of 100 in the 2009/10 annual survey to 40.9 in this survey up date. • The average rank of the Australian states fell to an average of 31st out of 51 jurisdictions in the update from 18th in the 2009/2010 index. • Both Nevada and Quebec also suffered drops in their attractiveness to investment due to attempts to introduce resource rent taxes, in Quebec's case without consultation.
The way forward Need to focus on a vision for state and regional Western Australia Need for an infrastructure planning response from government and industry Skilled labour remains a critical issue Tax policy settings which support growth and international competitiveness www.cmewa.com
WA Commodities Relative to World Production Alumina Diamonds Garnet Gold Ilmenite Iron ore LNG Nickel Rutile Salt Tantalum Zircon 0% 10% 20% 30% 40% 50% 60% 70% 80% 90% 100% Western Australia Rest of Australia Rest of World www.cmewa.com