Download
1 / 20
200 likes | 346 Views
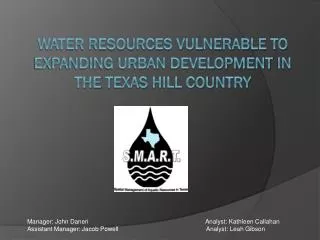
Water Resources Vulnerable to Expanding Urban Development in the Texas Hill Country. Manager: John Daneri Analyst: Kathleen Callahan

E N D
Water Resources Vulnerable to Expanding Urban Development in the Texas Hill Country Manager: John Daneri Analyst: Kathleen Callahan Assistant Manager: Jacob Powell Analyst: Leah Gibson
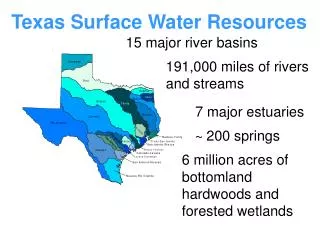
Goals and Objectives • Identify areas that are sensitive to development or other land use changes. • Specifically determine which groundwater and surface water areas are most vulnerable to non-point source pollution, taking into account various hydro-geologic and geographic criteria. • Use Geographical Information Systems to delineate the most vulnerable regions where development should not occur.
Data The analysis will be based on the following data: • Ground Vegetation • Soil Hydraulic Conductivity (KSAT) • Cave Density (Groundwater map only) • Soil Thickness/Depth • Floodplains • Slope All data is provided by Marston & Marston; excluding vegetation, which was acquired through the seamless data distribution server on the USGS website
Image Source: https://www.e-education.psu.edu/natureofgeoinfo/c9_p6.html
Formulas Groundwater Weighted Model: [(Soil Thickness*3) + (Soil KSAT*3) + (Cave Density*3) + (Slope*1) + (Vegetation*1)] / 11 Groundwater Weighted Model Mason County: [(Cave Density*3) + (Slope*1) + (Vegetation*1)] / 5 *Weights were determined by expert opinions of Dr. Richard A. Earl, and Dr. Laura Stroup
Formulas Surface Water Weighted Model: [(Slope*3) + (Vegetation*3) + (Soil KSAT*2) + (Soil Thickness*1)] / 9 Surface Water Weighted Model Mason County: [(Slope*3) + (Vegetation*3)] / 6 *Weights were determined by expert opinions of Dr. Richard A. Earl, and Dr. Laura Stroup
Results • The equal weight surface water map exhibited the most vulnerability while the weighted groundwater map exhibited the least. • The weighted surface water map had the most even distribution of vulnerability scores and the weighted groundwater map was the most skewed. • Both maps proved to be equally robust with 18% of the values remaining unchanged for both groundwater and surface water.
Website • Created by the S.M.A.R.T. team. Link: http://geo-305577.evans.txstate.edu
Conclusion • Future studies on groundwater and surface water vulnerability for this area should include more complete soil data for Mason County. Other criteria such as depth “Depth to Groundwater” would be useful for further research in order to perform a more comprehensive analysis.
The SMART team • John Daneri • Project Manager • Jacob Powell • Assistant Manager • Kathleen Callahan • GIS Analyst • Leah Gibson • GIS Analyst