Download
1 / 48
480 likes | 819 Views
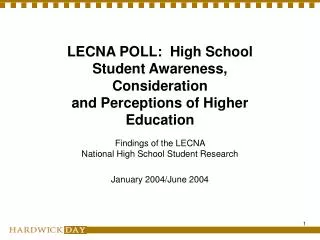
LECNA POLL: High School Student Awareness, Consideration and Perceptions of Higher Education Findings of the LECNA National High School Student Research January 2004/June 2004 Two Projects

E N D
LECNA POLL: High School Student Awareness, Consideration and Perceptions of Higher Education Findings of the LECNA National High School Student Research January 2004/June 2004
Two Projects The following charts comprise findings related to two different research projects conducted for LECNA by Hardwick~Day: • Fall 2003: national quantitative study in which 916 high school students participated in a 20-minute telephone survey on various topics regarding the college consideration process. 613 juniors and 303 sophomores were interviewed. An over sample of 200 Lutheran juniors were interviewed from lists obtained from ELCA and LCMS. The number of Lutheran students interviewed were proportionate to region of the country and Synod. • June 2004: a qualitative study consisting of five focus groups, four of which were student only sessions and a fifth for which the participants were parents of college bound high school students. In each of the groups, participant recruitment was structured to include both Lutherans and persons of other, or no, faith.
Two Avenues for Implementation • To inform and direct marketing activities of LECNA on behalf of the member colleges of the association • To inform/direct recruitment and marketing activities at, and on behalf of, individual member institutions
Our agenda for today: • Topics recap: • Communication with individual students • Communication with the larger market • Financing • Dissemination • Complete report for quantitative study to be sent via email • Already sent – complete videotape series of qualitative series • Today’s objectives: • Highlight a selected number of findings from both to illustrate • Inter-connectedness • Utility • Harness the brainpower of LECNA members for future projects
Students Expect to Participate in Many Activities in College • Students were asked to list extracurricular activities in which they plan to participate. • Over half listed athletics, especially intercollegiate athletics. • This percentage of intercollegiate participation is unrealistically high if they attend a public institution. • Sophomore males are especially likely to think they will participate in intercollegiate sports; by the junior year the males’ percentage drops somewhat to be similar to females’. • Academic clubs or band/orchestra appeal to a similar number, at about one in six. • Just less than one in ten plan to be involved in choir, and this percentage is not different for Lutherans. • Other activities not shown are mentioned by less than 5%. • Religious studies or youth ministry are mentioned by 2% of sophomores and 4% of juniors and Lutherans. Q. 9 While at college, what are some of the extracurricular activities in which you plan to participate?
There is opportunity to influence the college consideration and selection process among high school sophomores and juniors.
At This Point, Most Students Have Not Made a Definite College Decision • Two in five sophomores do not have a clear idea of the type of college or university they’d like to attend. • By the junior year, this has reduced to less than one in three. • One in ten sophomores and one in seven juniors already know which college or university they want to attend. • Of these, two-thirds of sophomores and half of juniors name a large public institution. • One in five in each age group name a private college or university. • The remainder mention two-year colleges or other unknown institutions. • One junior already plans to go to a Lutheran college. • Lutheran juniors respond similarly to the junior group as a whole on this question. Q. 3 Which of the following best describes how much thought you’ve already given to what college or university you might attend? If students haven’t given it any thought (6% of juniors), or have decided not to attend college (2%), they were not included in the study.
From the focus groups: • Provide understanding of the use of filter/screen in college choice process • All students were utilizing some sort of screen to ascertain which colleges they would or would not consider. Screeners appear to be based upon some sort of prior knowledge – not fact – and are open to shaping by word of mouth and innuendo • Students employed a screen or filter as well when deciding what to share with parents • Sharing with parents was usually done in an exceedingly informal way, utilizing casual forms of transmission. The preferred method was to leave brochures of interest in a location easily accessible to parents (kitchen counter). • Campus visits were unanimously the selection tool of choice
From the focus groups: • Colleges must recognize that all campus visits, regardless of student age, reason for visiting, or sponsor of visit, contribute to individual perceptions of campuses and programs.
One in Three Students Has Attended Some Form of Extended Learning Experience on a College Campus • Students were asked if they ever attended a camp or other extended learning experience on a college campus. • One in three students say they have attended such an experience. • There are no differences by income or region of the country. • Junior males (and Lutheran males) are less likely than females to have participated; this was not the case for the sophomores. • Students with higher GPAs, those with at least one parent who is a college graduate, and Caucasians are also more likely to have participated in an extended campus experience. • Christians (other than Catholics or Lutherans) are more likely than students with no religious affiliation to have participated on a campus. Q. 29 Have you ever attended a camp or other extended learning experience on a college campus?
From the focus groups: • Students put great emphasis on the look of a campus – not only for its beauty, but rating the quality of maintenance as well – “well-kept” “not run down” were very important descriptors.
From the focus groups: • At all stages – photographs are important. Must be in color, of the campus, casual and candid, not posed and not cute. Photos should be unique to the campus and not able to be used by any other college.
Ample evidence exists to justify, or even demand, segmented communication streams to sub-populations.
From the focus groups: • Early in the consideration process, students prefer materials which address the Jack Webb factor – just the facts – clearly stated – with no hype or puffery.
Sophomores Are More Likely to Say They’d Like a Lot of Extracurricular Options • Students were asked if they had to make a choice, which would they choose, having a lot of extracurricular options or a higher likelihood that they’d have a chance to participate. • Sophomores are looking for lots of options, while juniors are fairly evenly split. • Lutheran juniors are somewhat more likely to lean toward having a chance to participate. • Other groups more interested in having a chance to participate include lower income juniors, Midwest residents, and those whose parents are college graduates. Q. 8 If you had to make a choice, which is more important to you ?
Sophomores and Juniors Agree on How They Would Like Colleges to Help Them Grow As a Person • Students were asked to rate the importance of different skills. • Two in three rate “the ability to think independently” as “very important”--the highest of all skills rated. • Acceptance of different people and improving self-confidence are also very important to a majority. • Lutherans are less likely to place great importance on developing teamwork skills through participation in music or sports, or to have the ability to adapt to different settings. • Developing spirituality and growing faith are very important to about three in ten overall, especially Lutherans. • However, thereis a very different pattern between the two items: females are nearly twice as likely as males to find developing their own spirituality as important, but a roughly equal number of males and females wish to grow their faith through worship and service. Q. 5 In addition to academics, some colleges also strive to provide opportunities for you to grow as a person. Please tell me how important each of the following skills is to you. (Rating a “5” on a five-point scale, where 1=not at all important” and 5= “very important” to you).
Junior Females Are Most Likely to Be Interested in Good Faculty Advising There are no gender differences among Lutherans • Students were asked if they had to make a choice, which would they choose, having a lot of majors from which to choose, or good faculty advising to help them choose a major that is right for them from a smaller list of options. • While sophomores are fairly evenly divided, juniors tend to lean toward good faculty advising. • However, the good faculty advising is more important to junior females than males, by a wide margin. • Interestingly, this gender difference did not appear among sophomores or Lutheran juniors. • Good faculty advising is also more important to Lutheran juniors than having a lot of majors. • Other groups more interested in good advising include lower income juniors and Southwestern residents. Q. 8 If you had to make a choice, which is more important to you ?
From the focus groups: • Understand parental level of interest and understandings of college consideration process • Parents generally expressed interest in, support for, and concern about their child’s college selection process • Those with older children who had already negotiated the process were more well informed • Parents were able to express some explicit criteria for college choice that they had shared with their children, but it appeared that additional criteria went unspoken. None of the parents in the group were receiving communication directly from colleges or universities
There Are Many Regional Differences in Expected Participation in College Activities • For juniors living in the West, sports are less important, and band, choir, dance and clubs are more important. • For Midwestern juniors, only sports stand out as more important. • Southwestern juniors are less likely to be interested in sports and list the fewest activities of all groups. • Of all groups, Northeastern juniors are most interested in sports, and they are also more interested in drama or theater and community service. • At 23%, Southeastern juniors are twice as likely as other groups to be interested in academic clubs; they are also more interested in community service. • Students with higher GPAs are interested in slightly more activities.
Recap:Changes Between Sophomore and Junior Year • There is a significant increase in the percentage who have taken advanced placement and college courses from the sophomore to the junior year. • Juniors are nearly twice as likely as sophomores to work. Among those who work, the hours are the same, about sixteen hours per week. • There is a shift in thought about college; with 10% fewer juniors saying they have no clear idea yet of the type of college they’d like to attend. • Sophomore males have unrealistically high expectations for participation in intercollegiate sports in college; this drops by the junior year. • Similarly, sophomores prefer many extracurricular options in college, while juniors begin to believe having a chance to participate is more important. • By the junior year, females may begin to develop a preference for private colleges. They are significantly more likely than males to favor good faculty advising to lots of major options. • Juniors are less likely to agree that small colleges provide substantial scholarships that make them affordable. Although junior males are lowest on this characteristic, it is not significant. • When seeking college information, juniors have significantly more experience with college-initiated interactions and marketing, but the gap is much smaller when it comes to self-initiated interactions, indicating that sophomores are actively seeking available information • From the sophomore to junior year there is a increase in the number of students who indicate they have talked to their parents about how to pay for college, and especially additional consideration of financial aid. It is during the junior year that the strategy of choosing a less expensive college emerges. • Although the number remains low, twice as many juniors as sophomores have spending limits imposed by their parents and/or have eliminated colleges because of price.
Recap:How Lutherans Differ From the Total Junior Sample • Lutheran families are more highly-educated, church members, and Caucasian. Lutheran juniors are more likely to live in small towns or rural areas, attend smaller high schools and have higher GPAs. • Lutherans are more likely to place importance on growing their faith through worship and service, and less likely to believe adapting to different settings and learning leadership skills through music or sports participation is very important. • Lutherans are more likely to agree with small college attributes: they are more interested in a chance to participate in extracurricular activities and good faculty advising than having a lot of options in extracurricular activities or majors. • However, more than in the random population, there is a segment (especially higher-GPA Lutherans) who say an enrollment of under 4,000 makes them LESS interested in a college. • Lutherans are more likely to say a religious affiliation makes them more interested in a college (35% vs. 20% of the random population). • Lutherans are more likely to consider a college because someone they know has attended that college; especially friends, or boyfriend/girlfriend. • Lutheran juniors are more likely to indicate private colleges have an emphasis on values and ethics and a higher likelihood of finishing in four years. • Lutheran juniors are less inclined than the random population to say they will choose a less expensive option, then transfer. • Lutheran juniors, as compared to any other religious group, indicate the highest level of student contribution to college costs.
Recap:Regional Differences • The largest demographic differences between regions are in ethnicity and income. • For juniors living in the West, sports are less important, and band, choir, dance and clubs are more important. Acceptance of people who are different from them is a highly important skill. Western juniors place more importance on several characteristics, including faculty that get to know them, developing career skills, attending with involved students, an emphasis on values and ethics, and a campus where music has a presence. Western juniors are more likely to say state university funding was recently cut in their state; they are highest of all regions to claim a negative impact of the cuts. • For Midwestern juniors, only sports stand out as more important. Midwestern juniors are one group that is more likely to say a “religious affiliation” would make them more interested. They are somewhat more likely than other regions to indicate a public university as best in the state. Midwestern juniors are most likely to agree there has been large tuition hikes in their state. • Southwestern juniors are less likely to be interested in sports and list the fewest activities of all groups, however, they are far more likely than other groups to be interested in growing their faith through worship and service, and to say a “religious affiliation” would make them more interested in a college. Southwestern juniors are least likely to agree living on campus enriches the college experience, but are most likely to agree that small colleges provide substantial scholarships to make them affordable. Southwestern juniors differ from other regions by often attributing the private college characteristics--faculty that get to know them, courses taught by actual professors, and an emphasis on values and ethics--to public universities. Southwest residents are more likely to have spending limits imposed on them.
Recap:Regional Differences (Continued) • Of all groups, Northeastern juniors are most interested in sports, and they are also more interested in drama or theater and community service. They are least interested in developing their spirituality or growing their faith through worship and service. Northeastern juniors are morelikely to say that a private school, one located in another state, or a state school would make no difference in their consideration. Accordingly, they are lower than most other regions in saying these attributes would make them more interested in a college. They are the only region to mention a private college or university more often than a public as best in their state. They are leastlikely to agree large universities can be overwhelming, are lesslikely to believe it is important to attend with students who are motivated, and are morelikely to say there is no difference between private colleges and public universities on most attributes measured. Northeast residents are more likely to have spending limits imposed on them. • Southeastern juniors are twice as likely as other groups to be interested in academic clubs; they are also more interested in community service. They place greater importance on a program with a good placement record for jobs and grad school. Southeastern juniors are more likely to say state university funding was recently cut in their state.
Word-of-mouth, often generated by basic public opinion, is critically important.
Many Students Rely on Others’ Experience for College Advice • Students were asked if they are considering any colleges because someone they know attended or is planning to attend that college. • Over two in five sophomores and random juniors, and half of Lutheran juniors are considering a college because someone they know attended that college. • This is significantly lower among students whose parents did not graduate from college (32%). • This is more prevalent for all religious groups monitored, and significantly less for those with no religious affiliation (31%). • However, influencers are primarily family members and friends, and rarely specifically people from church (detail on next slide). • Another one-quarter of students are considering a college because someone they know is planning to attend that college. • This is especially true for lower income sophomores (36%), but not juniors, where there is no difference by income. Q. 30 Are you considering any colleges because someone you know… ?
Friends and Relatives Lead the List of People Who Will Have Some Influence Because they Attended or Will Attend a College • Students who are considering colleges because someone they know attended or is planning to attend that college were asked to name that person. • Friends, including boyfriends and girlfriends, top the list. • Family members follow, including siblings, parents, and other relatives (primarily cousins and aunts or uncles). • Family friends receive some mentions (2%-3%). • Very few students mention a high school teacher. • Less than 1% of any group mention a youth group leader or someone else from church. • Friends from church could be included among friends or friends of the family, however. Q. 31 And, who is that person? (based to total)
From the focus groups: • All of the students, regardless of the college search stage they self-identified, were evidently reacting not only to specific recruitment materials from colleges, but also to impressions and attitudes garnered from other, earlier, experiences.
Self-Initiated Interactions Indicate that Sophomores Are Hungry for College Information • Students were read a list of information sources and asked which ones they had used so far to gather information about colleges. • The gap in usage between sophomores and juniors is much smaller on those items that are either self-initiated or open to everyone. • About three in five students have talked to someone; high school counselors (23%), friends (19%), parents (16%), and teachers (8%) lead the list. • More than two in five juniors have visited a college campus and one in three rely on college rankings. • Church is a prominent source for Lutheran juniors (39%). Comparatively few juniors of other religions noted this source: Catholics (10%), other Christians (27%). • However, only 3 Lutheran juniors (1%) voluntarily mention speaking to a pastor, and 1% spoke to a youth group leader about college. Q.19A Please tell me what communication sources you have used so far to gather information about colleges. Have you used…
Most Useful Sources for College Information? Word-of-Mouth and College Marketing Materials Top the List • Students were asked which one of the information sources they had used so far they found to be most useful. • The most common response for all groups is talking to someone; high school counselors (6%), friends (4%), and current students at a college (3%) lead the list. • 1% of Lutheran juniors mention talking to a youth group leader as most useful. • The importance of college-generated marketing materials is seen in the next two items: college websites and brochures/ viewbooks. • High school visits and college fairs are also high on juniors’ list of useful sources, followed by general websites, campus visits and letters from colleges. • All other sources are mentioned by less than 3% of juniors. Only 1%-3% of students say none of the sources has been useful. Q.20 Which one of the sources you’ve used so far did you find most useful?
Most Students Expect an Answer to an Email Query in One Week or Less • Students were asked how quickly they would expect an answer to an email question. • Nearly half of juniors and 40% of sophomores expect a reply in less than one week. • Nearly one in five juniors expects a response within one day. • Another one-quarter of students expect a reply in one week, for a total of two-thirds of sophomores and three-fourths of juniors who expect a reply in one week or less. Q. 27 If you asked a college a question electronically, how quickly would you expect a response?
Sophomores and Juniors Have Similar Preferences for College Communication Methods • Students were asked which of four different methods of communication with prospective students they most prefer. • Sophomores and juniors have remarkably similar responses. • Mail from the admissions office is the most popular method, especially among those with higher GPAs. • One in four prefer calls from admissions counselors and emails from different entities at a college. • Students whose parents did not graduate from college are more likely to prefer calls from admissions counselors over other methods. • Fewer students prefer calls from current college students. Q.28 I’m going to read you four methods colleges use to communicate with prospective students. Think about how you prefer to be contacted. Which of these do you most prefer?
From the focus groups: • Personal communication is preferred BUT • Must be error free (name correct, no misspellings, etc.) • Must genuinely address areas in which student has an interest • If electronic: sender must be a recognized name or institution • Subject line: descriptive, accurate and not cute • Email is preferred for short communication only • Not one student had forwarded an email from a college to a parent • Strongly negative reactions to communication streams that “just kept coming”
From the focus groups: • Develop greater understanding of parents’ financial considerations and picture of ideal college financing process/system • Parents were aware of the existence of financial aid and financial planning for college, generally unaware of how to access that information. • Even those who were aware of the pathways for accessing financial information had not done so. • Most had no financial plan for the cost of college – but yet appear to have devised a strategy (we pay two thirds, student pays one-third; we pay direct costs, student to pay personal expenses) • Parents expressed high level of frustration with their inability to truly understand college costs prior to the admit/enroll decision in the spring of the student’s senior year
The Majority of Students Have Multiple Strategies to Help Pay for College • Students were read a list of strategies they might use to pay for college. On average, students will use five or six of the eleven choices given. • The vast majority plan to use work earnings, both from college and high school. • More than two of three will use students’ and parents’ savings. • Families where both parents are college graduates are more likely to have parental savings. • Juniors are more likely to mention applying for financial aid, indicating they perhaps have a more evolved plan. • This is especially true of lower-income students, rising from 64% of sophomores to 83% of juniors who say they will apply. • Three in five hope to use college classes taken in high school to reduce some college requirements. Q.36 Have you already, or will you do any of the following to pay for college?
A Minority of Students Have Discussed How They Will Pay for College with Their Parents • Students were asked if they had talked specifically to their parents about how they will pay for college. • Two in five juniors have talked to their parents specifically about how they will pay for college. • This is especially true of juniors with higher GPAs (44% vs. 34% of lower GPAs). • There are no differences between sophomores and juniors on this question. • Few (7% of juniors) say their parents have set a spending limit. • There is a marked increase since the sophomore year in limit-setting, from 3% to 7%. • Among juniors, Southwest and Northeast residents are most likely to have spending limits imposed. Q. 35 Have you and your parents talked specifically about how you will pay for college? Q. 40 Have your parents set a limit on how much they’ll pay?
Although Tuition Will Impact the College Choice Set for Half, Fewer Juniors Have Already Eliminated Colleges on Price • Students were asked if the total tuition will have any impact on the set of colleges to which they choose to apply, and if they have already eliminated any colleges because of price. • Half of juniors indicate that the total published tuition will impact their college application choices. • This is somewhat (but not significantly) higher than sophomores (43%). • Interestingly, juniors who have had an extended campus learning experience are more likely to indicate the tuition will NOT have an impact (57%) on their decision. • One in five juniors (and 12% of sophomores) say they have already eliminated colleges because of the tuition price. Q. 41 As you consider colleges, will the total tuition as stated by the college in their materials--that is, their published price, have any impact in determining the colleges to which you apply? Q. 42 Have you eliminated any colleges primarily because of price?
The Majority of Students Expect to Pay at Least Half of their College Costs Themselves • Students were asked how much of their college costs they expect will be paid by their parents. There are no differences by age group. • Nearly half (46%) of juniors say their parents will pay “all” or “most” of their college costs. • One in ten say “all,” and this percentage is higher among the higher income group (13% vs. 4% of the lower-income group). • One in four juniors expects to split the costs equally with their parents. • Another one in four juniors expects their parents to pay some, but less than half of their expenses. • One in twenty expects their parents to pay nothing at all. • At 8%, junior males are twice as likely as females (3%) to fall in this group. • Among lower-income juniors, 43% expect to pay all or most of their college expenses without their parents help (parents will pay “some” or “none”), compared to 21% of higher-income juniors. Q.37 How much of your college costs do you think will be paid by your parents?
Opportunity exists to trade upon the value perceived in the characteristics of LECNA member colleges…but…
The Vast Majority Agree with Statements Positively Showcasing Small, Private Colleges • Students were asked if they agreed or disagreed with these statements. • The groups are similar in their agreement that living on campus enriches the college experience, it is easy to make friends at a small college and large universities can be overwhelming. • Sophomores and Lutheran juniors seem more optimistic about the availability of scholarships and affordability of private colleges. • Although large universities are less likely than small colleges to be thought of as places where it is easy to make friends, students tend to agree large universities provide more opportunities to participate outside of class. • Males are especially skewed toward large universities in terms of opportunities outside of class. Q. 7 Please tell me if you agree or disagree with the following statements about colleges or universities.
From the focus groups: • Provide understanding of role of implicit or explicit parental parameters/guidelines in college choice process • Students shared general explicit parameters expressed by their parents, most of which related to distance from home • More involved discussion later in the groups revealed the existence of other, often covert, parameters established by parents (usually assumptions about either family finances, religious preference or location)
Several Characteristics Juniors Rate as Very Important In College Consideration Are Done Best by Private Colleges • Students were read a list of characteristics and asked to rate their importance in their consideration of colleges. • There are no differences by group. • About half of juniors rate finishing in four years, faculty that get to know you, courses taught by actual professors, a program with a good placement record for jobs and graduate school, and attending with students who are motivated to do well as very important. • The characteristic, “faculty that really get to know you” is more important to females and lower income students. • Lower income students also put more importance on the school’s job placement record. • “An emphasis on values and ethics in campus life” is very important to one in four, and is also more important to females than males. Q.32 I’m going to read you a list of characteristics about a campus or college in general. For each one, tell me how important it is in your consideration of colleges. (Rating a “5” on a five point scale, where 1=not at all important” and 5= “very important” to you).
From the focus groups: • Elicit candid response to common LECNA college attributes and elicit, if possible, alternate descriptive language from students • Six separate attributes were presented to students. Regardless of age (rising senior vs. rising college freshmen) or gender (girls vs. boys) all students had great difficulty determining meaning and value from the statements • Most were unable to express any alternate descriptors for the attributes
For the Most Part, Juniors See No Difference in Where These College Attributes Will Be Found • Students were asked where they thought they’d be most likely to experience each characteristic, at a smaller private college, a larger public university, or if there is no difference. • Juniors recognize small private colleges for faculty that really get to know you and courses taught by actual professors. • For all of the remaining characteristics, the majority see no difference between private colleges and large public universities. • This is especially true for the most important characteristic, finishing in four years. • Even so, more juniors think private colleges than public universities are likely to provide: • an emphasis on values and ethics in campus life • attending with students who are motivated to do well • attending with students who are involved, not just spectators • developing career skills like writing or critical thinking. • And more juniors think public universities than private colleges are likely to provide a: • program with a good placement record • campus where music has a major presence Q.33 Are you more likely to experience that at a larger public university, a smaller private college, or do you think there is no difference?
Students with Higher GPAs, College Graduate Parents, and Caucasians Give More Credit to Private Colleges • Juniors with higher GPAs, from families where both parents graduated from college, higher income, and Caucasians generally cite private colleges in higher percentages for faculty that get to know them, courses taught by actual professors, and an emphasis on values and ethics. • Caucasians are also more likely to cite private colleges as a place for attending with students who are motivated to do well, and involved students. • Lutheran juniors are more likely to indicate private colleges as having an emphasis on values and ethics and a higher likelihood of finishing in four years. • Southwestern juniors differ from other regions by often attributing the private college characteristics--faculty that get to know them, courses taught by actual professors, and an emphasis on values and ethics--to public universities. • Northeastern juniors are morelikely to say there is no difference between private colleges and public universities on most attributes.
Your assignment: • Meet briefly in small groups – each to identify at least one avenue for visibility/awareness to be pursued by LECNA • Reporting back