Download
1 / 29
290 likes | 418 Views
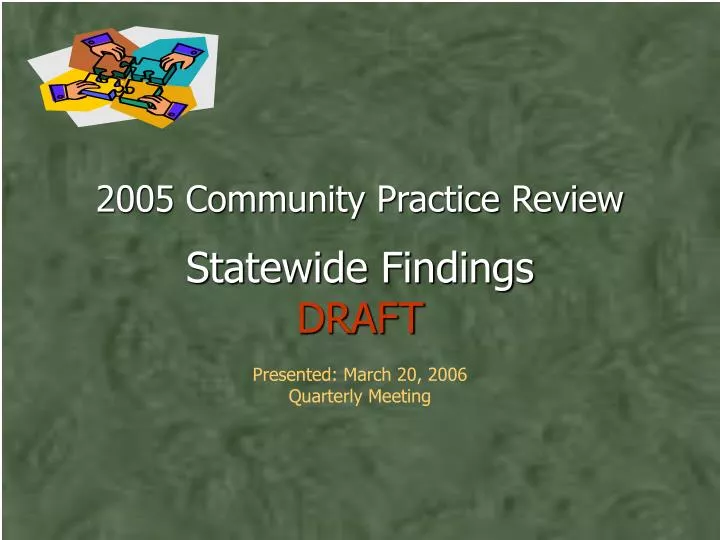
2005 Community Practice Review Statewide Findings DRAFT Presented: March 20, 2006 Quarterly Meeting. Class Member and Sample Information. Class Members: 395 Total Number in Sample: 101 (26%) Number of Agencies in the Sample: Independent Case Management: 21

E N D
2005 Community Practice ReviewStatewide FindingsDRAFTPresented: March 20, 2006Quarterly Meeting
Class Member and Sample Information Class Members: 395 Total Number in Sample: 101 (26%) Number of Agencies in the Sample: Independent Case Management: 21 Employment/Day Agencies: 39 Residential Agencies: 41
Class Members with Immediate or Special Needs Individuals Needing Immediate Attention: 9 People 9% of sample Individuals for whom health, safety, environment and/or abuse or neglect issues were identified during the review. Individuals Needing Special Attention: 27 People 27% of sample Issues were identified that may, if not addressed, effect the person’s health, safety and/or welfare. In 2004, 24 people required Immediate Attention (25%) and 18 people required Special Attention (19%). (96 people in the 2004 sample)
People are active in their communities • Twenty people are active bowlers. • Fourteen people are active swimmers. • Four people are involved in other types of sports, such as Tennis, Walkathons, Baseball, and Putt-Putt golf. Specific Examples of Good Practice • Seven people are zoo members – and two participate in prairie dog rescue. • Twenty people are members of and visit their local libraries – one person reads with the children during story hour!
Specific Examples of Good Practice People play valued roles in their communities • Two people are part of the special orchestra • Forty-two people attend church – and one volunteers in the nursery. • Seven people are members or volunteers at local clubs or shelters. • Thirteen people are involved with national awareness groups, including Special Olympics, People First!, Habitat for Humanity, and Meals on Wheels. • One person does presentations for non-disabled people.
Specific Examples of Good Practice People are interacting more and have friends • Forty-three people have non-paid friends with whom they meet and interact with in the community – one person regularly exchanges e-mail with two friends, and four have “significant others”. • Forty-four people are going more places or participating/interacting more while in the community. • Thirty-one people have increased their communication ability and/or their interactions with others --One person has learned to spell her name, and is beginning to learn letters and numbers.
Specific Examples of Good Practice People have shown evidence of progress • During the past year, eight people have shown a decrease in behaviors that have been identified as dysfunctional. • Thirty-one people are becoming more independent in their homes: cooking/meal prep, cleaning, personal hygiene, dressing and other daily tasks. • Nineteen people are becoming more physically active or have increased their mobility. • 687 assistive technology and adaptive equipment devices are needed by the members of the sample; 600 are in good repair, available, and used when needed. (87%).
Service planning and program intensity are not adequate. • 71% did not have a program of the level of intensity adequate to meet their needs. • 65% received services and supports recommended in the ISP (47% in 2004). • 21% had ISPs adequate to meet their needs. • 64% of the people achieved progress in the last year (56% in 2004). Findings: Person-Centered Outcomes Summary – Historical Scoring
Findings: Person-Centered Outcomes • More individuals are being provided with choices. • 74% of persons have daily choices/appropriate autonomy over his/her life (57% in 2004). • 87% of persons (70% in 2004) were provided the assistance and support needed to participate meaningfully in the planning process. • 69% have the opportunity to make informed choices. (46 CND) • 85% (55% in 2004) had choices about where and with whom to live. (47 CND) • 78% (60% in 2004) had choices about where and with whom to work/spend his/her day. (46 CND) • 83% (63% in 2004) had choices about where and with whom to socialize/spend leisure time. (41 CND) • For persons who are retired, 70% have adequate opportunities to engage in activities of interest during the day (47% in 2004). (80 N/A)
Findings: Person-Centered Outcomes • Integration improving, more opportunities needed. • 65% of persons have adequate access to and use of generic services and natural supports (44% in 2004). • 53% of persons were found to be adequately integrated into the community. (32% in 2004) • Daily lives are improving. • 92% of individuals’ cultural preferences are being accomodated. (82% in 2004) • 75% of people are treated with dignity and respect. • 98% of the sample have adequate food and drink available. (12 CND) • 90% of persons have adequate transportation to meet their needs. • 88% were found to have sufficient personal money. (16 CND)
Findings: Person-Centered Outcomes • The health and wellness needs of many class members are not being adequately addressed. • 69% of the persons’ health supports/needs are not being adequately addressed. (81% in 2004) • 67% of Teams did not arrange for and obtain the needed, relevant assessments (82% in 2004). • There was evidence/documentation of physical regression in the last year for 28% of the sample (29% in 2004). • There was evidence or documentation of behavioral or functional regression in the last year for 18% of the sample (32% in 2004). • 67% of the Teams are adequately addressing this regression. (19% in 2004)
Findings: Person-Centered Outcomes • Generally, people are safe at home and work. • 89% have day/employment environments that are generally clean, free of safety hazards and conducive to the work/activity intended. (71% in 2004) • 90% of residences are safe for individuals (void of hazards), (88% in 2004). • For 84% of the sample, the person’s residential environment offered a minimal level of quality of life. (82% in 2004)
Findings: Person-Centered Outcomes • When a determination could be made, individuals were found to get along with their staff. • 100% of persons get along with their case manager (74 CND)and find them helpful (87 CND). • 96% get along with their day program/employment staff. (31 CND) • 99% get along with their residential provider staff. (16 CND) • 82% of guardians determined the case manger was helpful. (23 CND)
Findings: Person-Centered Outcomes • Guardianship remains a key issue statewide • The level of participation for the guardians in the sample is: • Active: 40% (43% in 2004) 3 or + x month • Moderate: 35% (28% in 2004) 1 or + x month • Limited: 24% (27% in 2004) - than 12 x yr • None: 1% ( 2% in 2004) • 100% of the individuals for whom a determination could be made know his/her guardian (54 CND). • 75% of individuals (80 CND) believe their guardian is helpful (89% in 2004).
Findings: Person-Centered Outcomes Behavioral Supports and Services Are Improving Behavior Services – Historical Scoring
Findings: Person-Centered Outcomes More class members (CM) are receiving needed adaptive equipment, more are used and more work as intended. For many, assistive technology continues to be either unavailable, not used or not working. Communication assessments and services continue to be inadequate for more than half of the class members in the review. Historical Scoring
Findings: Person-Centered Outcomes There are fewer CM recommended for SE, fewer CM in SE as recommended and fewer CM having access to jobs that meet minimal standards for quality employment. Supported Employment - Historical Scoring
The IDT Planning and Implementation Process is not adequate for most class members. • For 83% of the class members reviewed, the IDT process was not adequate for assessing, planning, implementing and monitoring of services (up from 81% last year). • Of the ISP documents that were found to be adequate (21), 33% were not being adequately implemented. • For individuals who had less than adequate ISP documents, 24% were receiving current services that met their needs. Findings: Team and Planning Process
Findings: Team and Planning Process • Direct Support Staff need adequate input in the ISP. • 65% of day/employment direct service staff (up from 46% in 2004) have adequate input in to the person’s ISP. • 78% of residential direct service staff (up from 67% in 2004) have adequate input in to the person’s ISP. • Many IDTs are not using and following up on health assessments as needed. • 73% of individuals have teams that discussed their health-related needs (up from 49% in 2004). • 54% of teams considered what assessments were needed and relevant to the team’s planning efforts (42% last year). • Although an increase from 22% least year, only 54% of teams adequately used recommendations from assessments in planning.
More staff know their daily care responsibilities. • Overall, 77% of individuals had direct service staff able to describe their responsibilities in providing daily care/support to the person (up from 67% last year). • 84% of case managers understand his/her role/job (72% in 2004). • 86% of day/employment direct service staff were able to describe his/her responsibilities in providing daily care/supports to the person (76% last year). • 88% of residential direct service staff were able todescribe his/her responsibilities in providing daily care/supports to the person (79% last year). Findings: Staff Competency/Knowledge
Findings: Staff Competency/Knowledge • More staff “know” the person whom they support • 84% of case managers “know” the person (up from 70% last year). • 78% of day/employment direct services staff “know” the person (74% in 2004). • 89% of residential direct service staff “know” the person (up from 83%). • Staff need more health related information • 69% of team members interviewed were not able to describe the person’s health related needs (31% could, up from 29% last year). • For 50% of those in the sample, the case manger could describe the person’s health related needs (up from 44% in 2004). • Employment/Day staff could describe the person’s health-related needs 60% of the time, Residential staff could do so 63% of the time (up from 46% and 55%).
Findings: Staff Competency/Knowledge • Staff have received more training • 81% of residential staff received training on the ISP Process (60% in 2004). • 80% of employment/day staff received training on the ISP Process (60% in 2004). • 75% of the day/employment direct service staff received training on implementing this person’s ISP (58% last year). • 84% of residential staff received training on implementing this person’s ISP (up from 73% last year). • Overall, 67% of all direct service staff were found to have received training on the implementation of the ISP (51% in 2004). • For 90% of the sample, the case manager received training on the topics needed to assist in meeting the needs of the person. (68% in 04) • 73% of staff were trained on the behavior support plan (54% last year).
Team performance and follow up has improved, but needs further improvement. • 34% of IDT members are following up on their responsibilities. (25% in 04) • In 55% of the instances of team conflict, there was evidence that the team made efforts to build consensus. • 71% of teams were found to have adequate communication between meetings to ensure the person’s program is being implemented (51% in 2004) • Teams convened meetings as needed due to changed circumstances or needs 76% of the time (up from 51% last year). Findings: Performance Expectations
Findings: Performance Expectations • Teams have low expectations of growth for individuals • Less than half (47%) of IDTs have an appropriate expectation of growth for the person they support (25% last year). • 60% of case managers have appropriate expectation of growth for the person they support (36% in 2004). • 68% of residential direct service staff have an appropriate expectation of growth for the individuals (up from 49%). • 67% of employment/day direct service staff have an appropriate expectation of growth for the individuals (52% in 2004).
Findings: Performance Expectations • Case Management services are improving, knowledge of health related needs requires more attention. • 54% of case managers are not providing case management services at the level needed by the person (46% are, 34% were in 2004). • 83% of the individuals in the sample have case managers who are adequately available to them (78% were available last year). • 84% of the case managers know those whom they support. (70% in 2004) • 50% of the case managers were able to describe the health related needs of those whom they support. (44% in 2004)
Individual Service Plans are not adequate to meet the needs of class members. • 21% of ISPs were found to be adequate to meet the person’s needs. • Overall, 62% of FSAs gave adequate guidance to achieving the person’s long-term vision (up from 31% last year). • ISP goals in 61% of the sample were related to achieving the person’s long-term vision (31% last year). • 52% of ISP goals address the person’s major needs (24% in 2004) • Less than half (43%) of the objectives are specific and relevant to assisting the person in achieving his/her goals (18% last year). • 45% of the strategies were found to be sufficient to ensure consistent implementation of the services planned (up from 21%). Findings: Documents/Record keeping
Findings: Documents/Record Keeping • Individual Service Plans are not adequate • 44% of the recommendations and/or objectives/strategies of ancillary providers were integrated into the goals, objectives and strategies of the ISP (12% in 2004). • 62% of applicable ISPs contain a specific crisis plan that meets the person’s needs (up from 28% last year). • 74% of ISPs contain specific arrangements for primary health (medical) care (48% in 2004). • For 60% of the applicable class members, the ISP reflects how the person will obtain prescribed medications (42% last year). • 47% of the case manager’s records contain progress notes or other documentation that reflect the status of the goals and services of the key life areas stated in the ISP (up from 28% last year) • 53% of assessments were found to be adequate for planning (24% in 2004)
Findings: Documents/Record Keeping Individual Service Planning – Historical Scoring
Thank you! Lyn Rucker Community Monitor rpaltd@aol.com Office: 785-258-2214 Cell: 785-366-6468