Download
1 / 50
500 likes | 1.03k Views
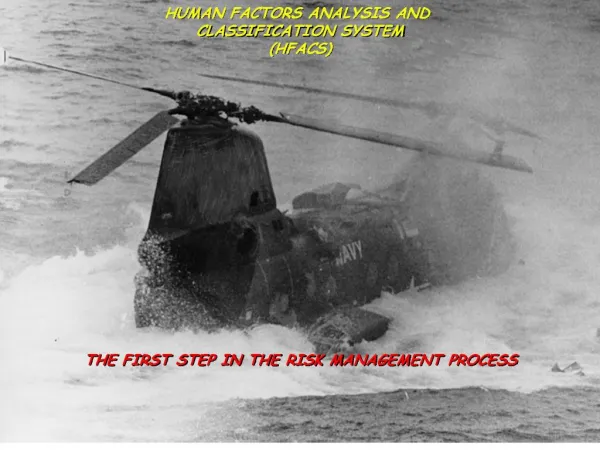
All NAVY/MARINE Class A, B,

E N D
32.
37.
44. Notes same as slide.Notes same as slide.
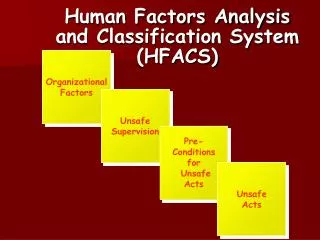
45. The percentage of accidents associated with each form of unsafe act (skill-based errors, decision errors, perceptual errors, and violations) are presented for each year of the study (1990-1998). Note that because each accident can have multiple causal factors associated with it, the percentages of accidents associated with each unsafe act will not equal 100%. Furthermore, because the percentage of one error form goes down does not necessarily mean that another must go up. In effect, they are independent of each other.
An inspection of the figure illustrates several heretofore, unknown facts regarding fatal GA accidents. First, there has been little impact of efforts to date on specific types of human error associated with fatal GA accidents (i.e., the lines are essentially flat). This is in direct contrast to what has been reported previously in military and commercial aviation using HFACS. Second, skill-based errors have been associated with 4 out of every 5 accidents (80%) since 1990. These skill-based errors are primarily technique (stick-and-rudder) type errors indicating failures associated with training and currency/proficiency. Third, nearly 40% of all fatal GA accidents are associated with violations of the rules, and are typically the result of �continuing� flight into instrument meteorological conditions when authorized visual flight rules only. It is important to point out that these violations are �willful� departures from the rules and not simply inadvertent flight into the weather (classified as a decision error). Like violations, decision errors were also associated with nearly 40% of all fatal accidents, but perceptual errors (often due to visual illusions and spatial disorientation) were associated with less than 15% of all fatal accidents. It should be pointed out that many of our current intervention strategies and research efforts have been aimed at these last two error forms.The percentage of accidents associated with each form of unsafe act (skill-based errors, decision errors, perceptual errors, and violations) are presented for each year of the study (1990-1998). Note that because each accident can have multiple causal factors associated with it, the percentages of accidents associated with each unsafe act will not equal 100%. Furthermore, because the percentage of one error form goes down does not necessarily mean that another must go up. In effect, they are independent of each other.
An inspection of the figure illustrates several heretofore, unknown facts regarding fatal GA accidents. First, there has been little impact of efforts to date on specific types of human error associated with fatal GA accidents (i.e., the lines are essentially flat). This is in direct contrast to what has been reported previously in military and commercial aviation using HFACS. Second, skill-based errors have been associated with 4 out of every 5 accidents (80%) since 1990. These skill-based errors are primarily technique (stick-and-rudder) type errors indicating failures associated with training and currency/proficiency. Third, nearly 40% of all fatal GA accidents are associated with violations of the rules, and are typically the result of �continuing� flight into instrument meteorological conditions when authorized visual flight rules only. It is important to point out that these violations are �willful� departures from the rules and not simply inadvertent flight into the weather (classified as a decision error). Like violations, decision errors were also associated with nearly 40% of all fatal accidents, but perceptual errors (often due to visual illusions and spatial disorientation) were associated with less than 15% of all fatal accidents. It should be pointed out that many of our current intervention strategies and research efforts have been aimed at these last two error forms.
46. The pattern of results was similar for non-fatal GA accidents. Again, the trends across the years were relatively flat, except for a sharp decline in skill-based errors evident in 1998 (note: this was not due to a small sample size, since it represents over 250 accidents).
As with fatal accidents, skill-based errors were associated with more accidents than any other error form, averaging roughly 80% of the accidents examined. Skill-based errors were followed by decision errors, which were associated with a little over 35% of the accidents and violations, and perceptual errors (less than 10%).The pattern of results was similar for non-fatal GA accidents. Again, the trends across the years were relatively flat, except for a sharp decline in skill-based errors evident in 1998 (note: this was not due to a small sample size, since it represents over 250 accidents).
As with fatal accidents, skill-based errors were associated with more accidents than any other error form, averaging roughly 80% of the accidents examined. Skill-based errors were followed by decision errors, which were associated with a little over 35% of the accidents and violations, and perceptual errors (less than 10%).