Download
1 / 34
370 likes | 640 Views
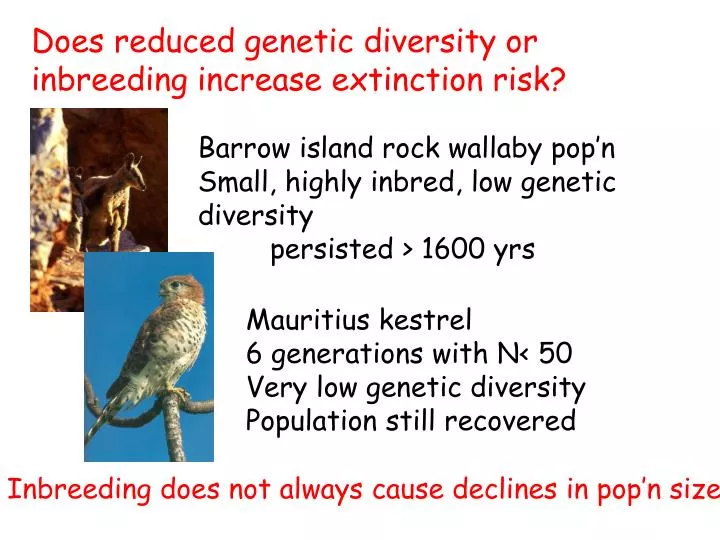
Does reduced genetic diversity or inbreeding increase extinction risk?. Barrow island rock wallaby pop’n Small, highly inbred, low genetic diversity persisted > 1600 yrs. Mauritius kestrel 6 generations with N< 50 Very low genetic diversity Population still recovered.

E N D
Does reduced genetic diversity or inbreeding increase extinction risk? Barrow island rock wallaby pop’n Small, highly inbred, low genetic diversity persisted > 1600 yrs Mauritius kestrel 6 generations with N< 50 Very low genetic diversity Population still recovered Inbreeding does not always cause declines in pop’n size
Does inbreeding increase extinction risk? Circumstantial evidence 1 Small populations are more prone to extinctions
Does inbreeding increase extinction risk? Circumstantial evidence. 2 Number spp. extinct since 1600 % on islands Mammals 85 60 Birds 113 81 Molluscs 191 79 Flowering plants 384 36 Island populations that are usually more inbred and less genetically diverse than mainland populations are more prone to extinctions Q. Why isn’t this conclusive? What else is different about island populations?
Does inbreeding increase extinction risk? Circumstantial evidence. 3 Island endemics are more inbred and more prone to extinction than non-endemics Endemics Non-endemics Frequency Higher extinction rate of endemic island species is predicted by genetic, but not demographic or ecological considerations
Does inbreeding increase extinction risk? Field evidence
Do small populations have lower genetic diversity? YES Does lower heterozygosity correlate with reduced survival or reproduction YES Does inbreeding reduce survival or reproduction? YES Does reduced genetic diversity or inbreeding increase extinction risk? SOMETIMES
TODAY Does the loss of genetic diversity limit the ability of species to adapt to change Change and evolution Quantitative traits: the basics Data The unresolved issue Friday Population size and evolutionary potential How big is big enough?
Environmental change New diseases eg canine distemper virus Pests and parasites eg Toxoplasma gondii Competitors and predators eg foxes Pollution Human induced climate change
Evolutionary responses to change Eg1 rapid evolutionary changes in response to industrial pollution Peppered moth 1848 first melanic recorded 1900 melanic form 99% in midlands 2000 melanic form down to 10%
Evolutionary responses to change Eg2 change in host preference in response to human induced habitat change Checkerspot Euphydras editha Original host: Collinsia parviflora Habitat change – cattle ranching reduces host abundance, introduces weed Plantago lanceolata P. l C. p
Q. Does inbreeding and the loss of genetic variation observed in small populations reduce their ability to adapt? Answering this Q requires a DETOUR into the genetics of quantitative traits
What do we know about genetic variation for quantitative traits?
Phenotypic variance = Sum contributions from genetic diversity environment + interactions between genes and environment VP = VG + VE + 2.CovGE Covariance between genetic and env effects Quantitative characters - Continuous distribution Influenced by many loci Affected by the environment Phenotype = Genes it inherits + Environment P = G + E
VA VD VI VP = VG + VE + 2.Cov GE genetic: Additive genetic variation alleles acting independently Dominance variance alleles affected by other alleles Interaction variance alleles affected by alleles at other loci
Additive Genetic Variation Single locus model - additive effects d=0 Allele 1 freq = p, Allele 2 freq = q Freq heterozygote = 2pq VA = 2pqa2 Variance is highest when heterozygosity is maximum Variance depends on a half difference in mean of 2 homozygotes
Evolutionary potential of quantitative traits • Evolution requires: • variation, heritability, selection VP = VG + VE +2CovGE S h2 = VA/VP VG = VA + VD + VI
Heritability – the relationship between the traits of offspring and parents Fig 5.5 The slope is a measure of heritability (h2)
Estimating heritabilities = regression of mean offspring on mean parent = 2x regression offspring on one parent = 2x correlation between full sibs = 4x correlation between half sibs Heritability estimates may be biased by shared environments, maternal effects and are specific to a particular pop’n in a particular environment
Magnitude of Heritabilities Most quantitative traits in outbreeding spp have heritable variation h2 > 0 Heritabilities are consistently lower for characters related to reproductive fitness than more periperal traits Heritability of fitness trait body size bill size Birds (n=19) 0.245 0.572 0.674
Evolutionary change - R R=Sh2 h2=slope
Predicting response to selection imposed by climate oscillations in Darwin’s finches 1976 – 1978 drought --> 85% mortality survivors had wider beaks than the original population S= 0.25 mm heritability = 0.745 Predicted response = R = S.h2 =0.25.0.745 = 0.19mm observed change = 0.25 mm 1984-86 selection favoured small bill width S = -0.10 Predicted response = R = S.h2 = -0.10x0.745 = -0.07mm Observed response = - 0.16 mm
Quantitative traits - key points VA determines ability of a pop’n to evolve VA is dependent on the heterozygosity of loci that affect that trait Population size influences inbreeding and the loss of heterozygosity so….. Small populations may have a reduced ability to adapt to environmental change
Loss of evolutionary potential (R) in small populations Isle Royale wolf population was founded by 1 pair This bottleneck reduces heterozygosity ( Ht/H0= 1-1/2N = 1-1/4 = ¾) VA = 2pqa2 andh2 = VA/VP so reduces evol potential by 1/4 via h2 • increases inbreeding • which reduces juv survival (if F =0.25 by 50%) • reduces competition to replace parents (2/302/15) • and reduces selection pressure • so reduces evol potential via S and Ne remains low (25 vs 5000) reduces heterozygosity loss = ∑[1-(1/2Ne)]t-1 so evol potential is further reduced via h2
What assumptions are involved in using these eqn’s to make this sort of argument? 1. Genetic drift is the major evolutionary force. Alleles are effectively neutral ie not selected upon 2. Mating is random No inbreeding avoidance 3. Loss of heterozygosity in quantitative trait loci conforms to theory based on neutral alleles
Does inbreeding and the loss of genetic variation reduce the ability to adapt? Experiments Field data on small and large populations Selection experiments on targeted traits
EXPERIMENTAL EVIDENCE Wild- control Bottleneck 1 pair 1 gen Inbred - homozygous Increase to same pop’n size Increase NaCl conc’n from 0% until extinction Frequency Frankham et al. 1999
Evolutionary potential in small populations 50 gen predictions based on R=S h2 ∑[1-(1/2Ne)]t-1 Data from Mice, flies, beetles, maize R50/R1 - cumulative response after 50 gen divided by response in first gen Evolutionary potential is proportional to Ne
FIELD DATA Wollemi pine - 40 adults No genetic diversity - 100s of markers No variation in resistance – 100% die No evolutionary potential Vulnerability to dieback root rot fungus Jarrah Mortality <30% to >90% Variation in resistance is heritable
Adaptation to climatic stress in Drosophila RAIN >2000mm 120+ raindays <1500mm <100 raindays H = 0.65 A = 8.4 allele/loci D. birchii - rainforest restricted fly Hoffmann et al 2003 Science
Adaptation to climatic stress in Drosophila RAIN wet Less wet Dessication resistance (hours to 50% mortality) increases with latititude
Adaptation to climatic stress in Drosophila expected Response to selection 50 generations 30 selection events • Molecular variation H=0.65 A=8.4 • Quantitative variation • Dessication resistance h2=0 • Wing size h2= 0.386-0.706 Evolutionary potential is best estimated in targeted ecological traits using spp in threatened habitats
Do small populations have higher levels of inbreeding, reduced heterozygosity and lower levels of genetic variation? YES Does inbreeding/loss of heterozygosity reduce a population’s ability to adapt? YES What is the unresolved issue?
How closely correlated are molecular and quantitative measures of genetic variation? Reed and Frankham meta-analysis - 71 datasets mean corr r = 0.22 H and life history traits r = -0.11 ns H and morph traits r = 0.30 Molecular measures of variation provide a very imprecise measure of evolutionary potential
After reviewing this lecture you should now be able to: Calculate Ne, H, F Understand how/why Ne influences heterozygosity, inbreeding and evolutionary potential Explain why it may be important to conserve genetic variation Argue why genetic data should/should not inform conservation actions