Download
1 / 48
480 likes | 658 Views
URBAN SPRAWL AND LAND COVER CHANGE LANDSAT DATA APPLICATIONS IN THE CLASSROOM FRANK NIEPOLD, SSAI EDUCATIONAL RESOURCE DEVELOPER LANDSAT PROJECT SCIENCE OFFICE. OBJECTIVES OF PRESENTATION Project Goals.

E N D
URBAN SPRAWL AND LAND COVER CHANGELANDSAT DATA APPLICATIONS IN THE CLASSROOMFRANK NIEPOLD, SSAIEDUCATIONAL RESOURCE DEVELOPERLANDSAT PROJECT SCIENCE OFFICE
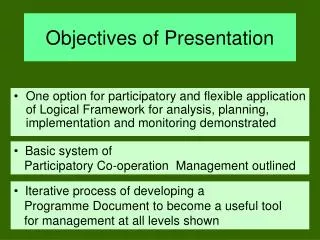
OBJECTIVES OF PRESENTATION Project Goals • Human transformation of the Earth's surface can be demonstrated using time series satellite imagery and aerial photography • What is Landsat data • What is remote sensing • Uses of these data types in the classroom • How to obtain the data and supporting software
LANDSAT PROJECT OVERVIEW • Benefits of the Landsat project over other Remote Sensing Missions • Benefits of Landsat 7 over other Landsat missions.
Benefits of the Landsat project over other Remote Sensing Missions • Mission Continuity: spanning 27 years of multispectral imaging of the Earth's surface, starting in 1972. • Global Survey Mission: Approximately one quarter of the Earth's landmass will be imaged every 16 days. Every landmass will have seasonal coverage. • Affordable Data Products: Landsat 7 data products will be available from the EROS Data Center. Prices will now drop from approximately $5,000 to $600 per scene. Most teachers will be able to get the data for free.
Landsat Image Resolution Landsat Multispectral Scanner 80 m Landsat Thematic Mapper 30 m Spot Panchromatic Band 10 m Spot Multispectral Scanner 20 m
Washington D.C. Landsat 5 infrared red band 1991 Landsat 7 panchromatic band 1999
Washington D.C. Detail Landsat 5 infrared red band 1991 Landsat 7 panchromatic band 1999
Remote Sensing Overview • What is “remote sensing”? • Using artificial devices, rather than our eyes, to observe or measure things from a distance • How is remote sensing done? • Electromagnetic spectrum • How satellite remote sensors work (briefly) • Training and validation sites • Why is remote sensing useful? • It enables us to observe & measure things on spatial, spectral, & temporal scales that otherwise would not be possible
Why Is Remote Sensing Useful? • Remote sensors enable broad spatial coverage & high temporal resolution • Remote sensors enable us to observe & measure the causes & effects of climatic & environmental changes (both natural & human-induced) • Classroom Projects • Urban Sprawl or Growth analysis • Impervious surface mapping using satellite image land cover maps • Measurement of Earthworm Biomass differences relating to land cover alteration
Remote Sensing: Advantages • Remote sensing provides a regional view. • Remote sensing provides repetitive geo-referenced looks at the same area. • Remote sensors "see" over a broader portion of the spectrum than the human eye. • Sensors can focus in on a very specific bandwidth in an image. • They can also look at a number of bandwidths simultaneously. http://www.utexas.edu/depts/grg/gcraft/notes/remote/remote.html
Remote Sensing: Uses • Remote sensing is useful because it gives us the "big view." Our nightly weather pictures would be impossible without remote sensing -- so would charting changes in the state of the Earth's land, oceans, and atmosphere. These Landsat images show Mount St. Helens several years before and after its 1980 eruption. The light blue in the second image shows the zone of destruction to the north of the original summit.
Remote Sensing: Uses These images are of the same area on the east coast of Africa. Each image represents an area ~110 miles wide by ~102 miles north to south. Note that the lakes in the middle of the left image “grew” to represent a flooded area that is well over 50 miles wide in the right hand image. Imagine trying to escape these flood waters on foot! Images courtesy of NASA and USGS
Remote Sensing: GLOBE Video
The Electromagnetic Spectrum • Remote sensing uses the radiant energy that is reflected and emitted from Earth at various “wavelengths” of the Electromagnetic Spectrum. • Our eyes are only sensitive to the “visible light” portion of the EM spectrum. • Why do we use the nonvisable wavelengths?
Bands on Landsat’s Thematic Mapper Landsat’s Thematic Mapper has detectors sensitve to 7 wavelengths, “or bands,” of the EM spectrum—ranging from visible light to infrared radiation.
Landsat’s Bands (cont.) Landsat collects monochrome images in each band by measuring radiance & reflectance in each channel. When viewed individually, these images appear as shades of gray.
Color Composites The human eye is not sensitive to ultra-violet or infrared light. To build a composite image from remote sensing data that makes sense to our eyes, we must use colors from the visible portion of the EM spectrum—red, green, and blue.
chs.3,2,1 “True Color” Landsat Image This image was produced using the red, green, & blue bands from Landsat’s Thematic Mapper. Note the washed out appearance of the landscape due to the atmosphere’s effect.
“False Color” Composite Images To interpret radiance measurements in infrared portion of the EM spectrum, we assign colors to the bands of interest and then combine them into a “false color” composite image.
chs.4,3,2 chs.5,4,2 “False Color” Landsat Image This image was produced using IR bands, red and green. Notice how vegetation is more clearly distinguished from nonvegetation.
Why do we use the nonvisable wavelengths? Spectral Signatures of Some Targets http://www.globe.gov/sda-bin/wt/ghp/tg+L(en)+P(implementation/remotesensing)
Why use these data types in the classroom • Rationale of interdisciplinary project • Immersion learning • Ownership of learning • Inquiry based • Relevance to the students lives • Diverse learning styles provided for by cooperative teaching strategies .
How use these data types in the classroom • Rationale of Landsat imagery uses in an interdisciplinary project • Image processing • Image Analysis • Remote Sensing • Temporal and Spatial Physical and or Political Geography studies .
Planning The Project • Administrative Support • Faculty Involvement (for interdisciplinary use) • Time Commitment • Student Assessment • Curriculum Materials • Community Involvement (for the role playing and town meeting)
Appropriate Academic Classes Middle School6-8 High School9-12 • Earth/Life Science • History/Geography • Math • English • Earth Science/Biology/Environmental • Science • US History/Ethics/Economics • Algebra/Geometry/Trig/Statistics • Introduction to Literature/English • Computer Science
How to implement the project • STEP ONE: Review the basic concepts of remote sensing and digital image processing • STEP TWO: Determine extent of growth using Landsat data • STEP THREE: Determine how each issue is affected by urban growth • STEP FOUR: Prepare presentation
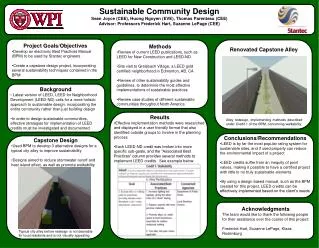
Why do we use the nonvisable to study plants and urban growth? Typical spectral response characteristics of green vegetation Landsat images can isolate plants from all other types of land cover due to some simple plant physical properties in the way they reflect light back into space. If you look at the graph, graph. it shows a typical spectral signature of green vegetation. Brigitte Leblon, Ph.D.Remote Sensing and GIS Laboratory http://research.umbc.edu/~tbenja1/leblon/frame9.html
near IR red NDVI near IR red NDVI Creation and Use The vegetation indices that is used in this project is the Normalized Difference Vegetation Index (NDVI) Simply put, vegetation indices are used to isolate vegetation’s presence and condition from other factors.
NDVI Creation • The reason the created image is called NDVI is that the new image is showing the change in NDVI pixel values between two NDVI images.
NDVI Use • The reason the created image is called NDVI is that the new image is showing the change in NDVI pixel values between two NDVI images. Manual Interpretation
NDVI Manual Interpretation NDVI analysis and interpretation.
Ancillary Images or Maps • Available images are the following: • 1998 aerial photographs 60”x 60” (B&W) • 1984-1997 FSA all scale aerial photographs 36”x 20” (color) • 1997 Landsat satellite images 36”x 36”(B&W) • 1984 Landsat satellite images 36”x 36”(B&W) • 1993 county woodlands map 36”x 72” (color) • Park and Planning School GIS Topographic map 1-2,400 scale • Park and Planning School aerial photograph image group • Park and Planning School GIS Zoning map • Washington D.C. and vicinity 1: 100,000- scale satellite image map using band 1, 3, 5 taken on November 2 1982 • School Topographic map1-2,400 scale • School Topographic map series that shows more of the surrounding area 1-2,400 scale
Aerial Photography Use NDVI analysis and interpretation.
Aerial Photography Use NDVI analysis and interpretation. NDVI 1984 AERIAL PHOTOGRAPH 1998 NDVI 84-97
Field-based Validations Any sites of change that can not be identified by the maps or aerial photographs can be identified by field-based validations. NDVI Image Aerial Photo
Implemented Academic Classes Field Work Earth Worm Biomass Mapping Create the training and validation sites for the various remote sensing projects that can be developed to study the effects of urban expansion Land cover mapping Impervious Surface Mapping Urban Sprawl Mapping
Detailed Information about this project Background Information Prototype Implementation of an interdisciplinary project Remote Sensing How Individual Teachers Implemented Landsat Data Availability Results Materials and suggestions on how to Implement Related Sites How to obtain the data and lesson plans online • What will be available online? How to obtain data Lessons/Activities Grades 9-12 Grades 6-8 Software/ImageTutorials Interactive Simulations
How to obtain the data and supporting software • Global Learning and Observations to Benefit the Environment (GLOBE) is a worldwide network of students, teachers, and scientists working together to study and understand the global environment • Teachers can be trained nationally and receive Materials including a Landsat image of their school • GLOBE has agreed to distribute older images free of charge to teachers who complete the land cover protocols • The second image will be georeference to the first, which is difficult to do and expensive
How to obtain the data and supporting software • MultiSpecMultiSpec is being developed to for analyzing multispectral and hyperspectral image data. • TNT Lite is a free version of TNTmips for students and learning professionals.TNTmips is the Map and Image Processing System, advanced software from MicroImages, Inc. for geospatial analysis. • Landsat Thematic Mapper Data Sets The items listed below represent those data sets and .gif images currently available for download. In order to process the data sets, you must use an application such as MultiSpec.
Welcome To the Landsat 7 Gateway! http://landsat.gsfc.nasa.gov/
EROS Data Center, Sioux Falls, SD http://edcwww.cr.usgs.gov/eros-home.html
Landsat in the Classroom Educational Web Sites Related to Landsat The following web sites/educational materials have completed the ESE educational review process and are recommended by NASA's Earth Science Enterprise.
The Adventure of Echo the Bat (Grades 5-8) • Classroom of the Future: Exploring the Environment (Grades 9-12) • Geomorphology from Space (Grades 9-12)
Remote Sensing Tutorial (Undergraduate/General) Additional Educational Web Sites • Virtual Nebraska (9-12)
Landsat Thematic Mapper Datasets at NASA's Observatorium (9-12) • Consortium for the Application of Space Data to Education (9-14) • NASA Goddard Earth & Space Science Education Project (GESSEP) (5-8 and 9-12)
Virtually Hawaii (5-8) • Earthshots: Satellite Images of Environmental Change (5 8 and 9-10)