Download
1 / 16
160 likes | 267 Views
Active Region Upflow Plasma and its Possible Contribution to the Slow Solar Wind. J. L. Culhane 1 , D.H. Brooks 2 , L. van Driel-Gesztelyi 1,3,4 , P. Démoulin 3 , D . Baker 1 , M. L. DeRosa 5 , C. H. Mandrini 6,7 , L. Zhao 8 , T.H. Zurbuchen 8

E N D
Active Region Upflow Plasma and its PossibleContribution to the Slow Solar Wind J. L. Culhane1,D.H. Brooks2, L. van Driel-Gesztelyi1,3,4, P. Démoulin3, D. Baker1, M. L. DeRosa5, C. H. Mandrini6,7, L. Zhao8, T.H. Zurbuchen8 1University College London, Mullard Space Science Laboratory, Dorking, UK 2 Naval Research Laboratory, Washington DC, USA 3Observatoire de Paris, LESIA, Meudon, France 4Konkoly Observatory, Hungarian Academy of Sciences, Budapest, Hungary 5Lockheed Martin Solar and Astrophysics Lab oratory, Palo Alto, CA, USA 6Instituto de Astronomia y Fisica del Espacio (IAFE), CONICET-UBA, Buenos Aires, Argentina 7Facultadde Ciencias Exactas y Naturales (FCEN), UBA, Buenos Aires, Argentina 8Dept. of Atmospheric, Oceanic and Earth Sciences, Univ. of Michigan, Ann Arbor, MI, USA,
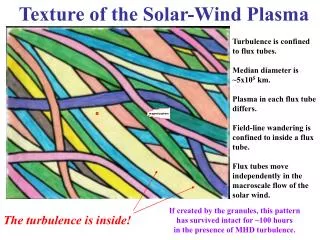
Hinode XRT/EIS Discovery of Persistent AR Upflows • EIS observed upflows of ~ 50 km/s (Harraet al., 2008) in the region of upflow seen by XRT (Sakao et. al., 2007) • - persistent upflows seen from AR peripheries with temperatures: 1 MK ≤ Te ≤ 2.5 MK • - morphology differs from fan-loops where plasma is downflowing with Te~ 0.6 MK • - upflows mainly originate at sites of Quasi-SeparatrixLayers (QSLs) • Comment by Sakao et al that AR upflowscould contribute ~ 25% to Slow Solar Wind has led to significant interest in the topic but they did not suggest any outflow paths
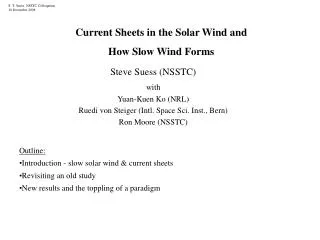
AR Plasma Outflow Paths (van Driel-Gesztelyi et al., 2012) • AR1/AR2 observed by Hinode/EIS in Fe XII emission (a) with significant NE upflow at AR1 (b) • - LFFF extrapolation (c) shows QSL footprints and long, possibly open, field lines from QSL and upflow region • LFFF model shows null at 102 Mm height between AR1 and AR2; supported by potential field model (d) • - these models only describe the AR1/AR2 neighbourhood NULL • Global PFSS model addresses full-Sun (a) and • shows AR1 fully covered by streamer (b; yellow) • Null point and its spine field line extend to PFSS • source surface at 2.5 Rʘ • - provides upflow plasma pathway to heliosphere • - related AR-composition plasma later detected • by ACE spacecraft AR 1 AR 2
Summary of Topics Covered • AR 10978 passed disc centre 10 – 15 Dec. 2007; upflowsstudied by Hinode/EIS • - plasma parameters (Te, ne, v, FIP-bias) measured as f(t) • Upflow inclinations to LoS estimated by Démoulin et al (2013) from systematic changes in the • flows with solar rotation • -linear force-free field (LFFF) extrapolation for local AR field gave consistent upflow results and • allowed identification of Quasi-Separatrix Layers (QSLs) • NSO/GONG PFSS model shows that the inward HeliosphericCurrent Sheet (HCS) projection • bisects AR 10978 • Global PFSS model shows AR 10978 completely covered by helmet streamer closed field • - not clear how anyupflowing plasma could reach heliosphere and contribute to slow solar wind • Back-mapped ACE in-situ plasma data show that increases in O+7/O+6, C+6/C+5 and • Fe/O(FIP bias proxy) are present from just ahead of the HCS crossing Westof the AR • - this looks very like AR-originating material • Mandrini et al. 2014 suggest a mechanism for upflow material from AR 10978 to reach • the heliospherefollowing at least two reconnections and be detected by ACE
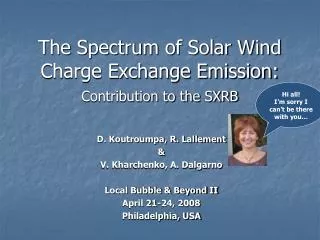
AR 10978 and Associated Upflows • From 10 – 15 Dec. 2007, AR 10978 passed Central Meridian (CM) • - AR 10978 and the two principal associated upflow regions at its boundaries are shown below 12 Dec. 2007, 11:43 UT 14 Dec. 23:59 UT 10 Dec. 2007, 00:07 UT 10 Dec. 2007, 00:19 UT 15 Dec. 2007, 00:13 UT 12 Dec. 2007, 11:43 UT • Upflows persistent during 5 day interval • - XRTimages are with Ti/Polyfilters;EISvelocity maps from Fe XII/195.12 Å line profiles • - apparent upflow velocity reversal from West to East due to flows’ changing inclination to line-of-sight
Upflowing Plasma Properties • Plasma parameters for East and Westupflows • - temp. (Te), density (ne), FIP-bias (fFIP) • ne estimated from Fe XIII line intensity ratio • ( I202 .0Å/I203.8 Å) • Te and FIP-bias are obtained from Differential • Emission Measure (DEM) analysis • FIP-bias values 3.0 ≤ fFIP ≤ 4.0 characteristic of • slow solar wind • Démoulinet al., 2013 studied both upflows in detail • - flows are spatially coherent thin fan-like structures • - inclined to LoS with dEast~ - 500 and dWest~ +200 • - velocity and temporal evolution similar for all lines • - strong stationary component suggests days/weeks duration • for driving mechanism • Flows usually located at Quasi-SeparatrixLayers (QSLs)
Linear Force Free Field (LFFF) Extrapolation for AR 10978 • Topological analysis in the linear force-free field extrapolation (Démoulin et al., 2013) • allows identification of Quasi-Separatrix Layers (QSLs: black lines) • Upflows originate from these QSL sites • Upflows from reconnection at QSLs between • dense AR loops and long low-density loops • Reconnection at QSLs results from AR growth • and dispersion • LFFF magnetic field configurations are valid close to the AR • - computed field lines at AR borders have similar inclinations to those • shown by direct modelling of the EIS upflows • - they do not imply that the upflowing plasma leaves the Sun QSLs
AR 10978 related to Global Magnetic Field Configuration • Carrington (CR 2064) display of a Stereo-B EUVI image shows AR and two nearby opposite • polarity CHs • NSO/GONG PFSS model: open field reaches the source surface at 2.5 Rʘ • - inward projection of HCS bisects • AR and separates East and West • upflow regions • - red/green areas show –ve/+ve • polarity of open B-field regions • - grey area shows mainly closed • B-field regions and LoS • magnetogram features for • AR 10978 • - HCS
Global Solar Magnetic Field Configuration • PFSS model for 12-Dec-07 shows large-scale topological structures and AR 10978 • - helmet streamer separatrix • surface in semi-transparent • yellow (a) • - AR shown without helmet • surface (b) • - AR in closed–field region • fully covered by streamer • - streamer is bordered by the • two adjacent CHs, E and W • of the AR • - continuous blue line (a) • shows the HCS • Right-hand panel (b) has the helmet surface removed for clarity • -LoS magnetic field structures of AR 10978 are shown • - spine field lines (light-blue) do not enter the open field domain but remain closed below the streamer • - thus long low density loops carrying the upflowing plasma are fully contained below the streamer • - not obvious how plasma with AR composition could gain access to the Heliosphere
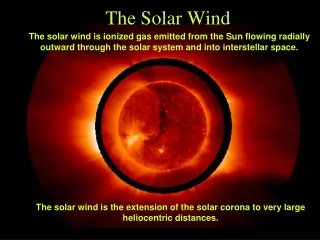
ACE in-situ Observations Related to AR 10978 Passage 30 Nov, 2007 27 Dec, 2007 • Back-mapped ACE data shown relative to a) ST-B EUVI 195 Å synoptic map for CR 2064 • Data include:b) vp c) He/p, d) O+7/O+6andC+6/C+5, e) Fe/O, f) Bradial, g) Babs - red line indicates change in Bradial polarity seen at ACE which shows HCS crossing • Increases in O+7/O+6, C+6/C+5and Fe/O (FIP bias) are present from West of the HCS crossing -active region material in a slow solar wind flow - reduction in He/p indicates streamer tip contribution • Fast solar wind parameters are evident before and after the HCS transition • Fast wind flow originates from the two adjacent CHs that are E and W of AR 10978 a) b) c) d) e) f) g)
Possible Mechanism for Plasma Escape from AR 10978 • Mandrini et al., (2014) analysed the global magnetic topology • - located four high altitude magnetic null points within ± 200 latitude • of AR 10978 • - only one of these (N1) has associated open field lines N1 • AR loops (blue) reconnect with large scale network fields (red) • at the Eastern QSL • - reconnection driven by AR expansion (green arrows) puts AR • upflow plasma into long low density network loops N1 • These large scale loops reconnect with the open field lines (pink) at N1 that are associated with the Northern CH
AR Upflow Contribution to Slow Solar Wind • View of AR 10978 from 450longtitude shows open field lines bending towards the ecliptic while • for 00longtitudefield lines seen directed towards the Sun-ACE line N1 N1 Longitude 450 E Longitude 00 • Open field lines bend towards the ecliptic and so can deliver the upflowing plasma from East • of the AR to the Sun – ACE line before the HCS passage i.e. from the North-West
Conclusions • Discovery of AR upflows and identification of path to Heliosphere were sumarized • Detailed measurement of upflow plasma properties for AR 10978 in December, 2007 showed typical active region values which are also found in the slow solar wind • PFSS models show: a) HCS bisects the AR, b) AR completely covered by helmet streamer • ACE in-situ plasma data were displayed relative to a Carrington synoptic map (CR 2064) for the interval 30-NOV-2007 to 27-DEC-07 which includes the disc transit of AR 10978 • ACE data backmapped and related to polarity change in Br - clear that speed and composition assume slow wind characteristics West of the AR - given streamer coverage of the AR on both sides of the HCS, not clear how AR plasma escapes • Mandrini et al. show how upflow material originating from East of the AR can reach ACE from West of the AR following at least two magnetic field reconnections • Further study needed to establish level of AR plasma contribution to Slow Solar Wind
Back-mapping Plasma Flow from ACE (L1) to the Sun • Back-mapping from the ACE spacecraft is in two stages • - radial ballistic mapping from L1 to the 2.5 Rʘsource surface • - PFSS extrapolation from source surface to photosphere • - uncertainty ~ 100 • ACE proton speed data shown on ST-B EUVI 195Å image • - proton speed (Sun to ACE) shown with red/fast and blue/slow • solar wind • - ACE solar footprint, HCS and Bradial also indicated Br ACE Footprint HCS
Modeling where the slow wind comes from Some of the plasma flows remain confined, others get out and from magnetic modeling we can say exactly which ones. The coronal hole provides a route for the upflows to become outflows. van Driel-Gesztelyi, Culhaneet al., Solar Physics, 2012.