Download
1 / 13
130 likes | 239 Views
Explore quasi-periodic upflows in the solar active region using a combination of imaging and spectroscopic observations, interpreting propagating disturbances as waves. Discover insights into coronal inhomogeneity, heating issues, and EUV/X-ray emissions.

E N D
HuiTian High Altitude Observatory, National Center for Atmospheric Research Quasi-periodic upflows in the solar active region ASP research review 2010/10/27
Outline • The solar corona • Propagating disturbances interpreted as waves • Combination of imaging and spectroscopic observations • Oscillations driven by repetitive upflows • Conclusion
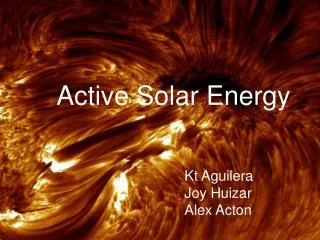
The solar corona • Highly inhomogeneous corona • Extremely hot corona • Heating problem • EUV & X-Ray emission AIA/SDO 193 Å Peter, 2004, Reviews in Modern Astronomy Image Credit: SDO
Propagating disturbances interpreted as waves • Propagating disturbances in imaging observation • Period: 3-30 minutes • Speed: 50-200 km/s • Interpreted as magneto-acoustic waves De Moortel, 2002, Astronomy & Astrophysics
Combination of imaging and spectroscopic observations (I) • XRT observation • 3-min cadence image sequence • Relentless upflows at the boundary of the AR
Combination of imaging and spectroscopic observations (II) • EIS observation • 32-s cadence SAS spectra • Several emission lines • Fe XII 195.12 Å • Fe XIII 202.04 Å • Single Gaussian fit • Intensity • Doppler shift • Line width • R-B
Oscillations driven by repetitive upflows (III) black: intensity red: Doppler shift (inverted) green: line width purple: R-B (inverted) blue: relative intensity of the 2nd component cyan: relative Doppler shift of the two components
Oscillations driven by repetitive upflows (IV) Doppler shift & R-B are inverted in time series
Conclusion • Coronal oscillations could be signatures of • Waves • Repetitive upflows • Spectroscopic observations could distinguish between the two phenomena • Waves: double frequency of line width; excess blueward and redward emission alternatively • Upflows: same frequency of intensity, Doppler shift, and line width; repetitive excess blueward emission • The upflows could be the result of impulsive heating at the lower layers and may be an efficient way to provide the corona with hot plasma Reference: Tian et al., ApJ, 727, L37, 2011