Download
1 / 28
280 likes | 468 Views
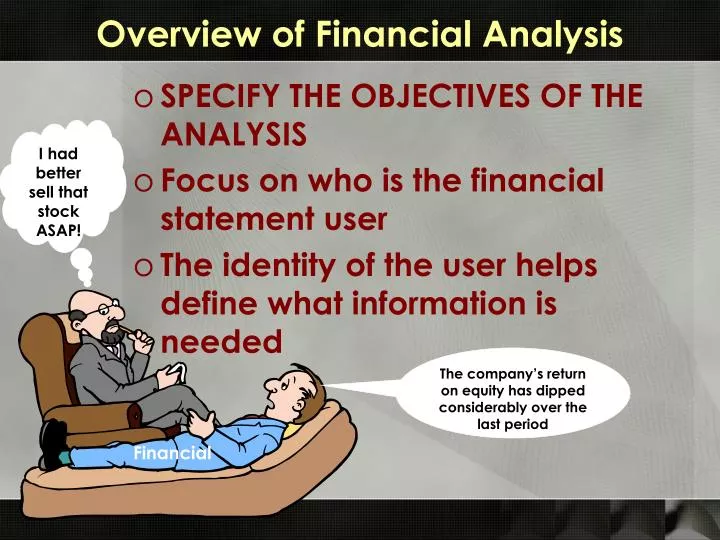
Overview of Financial Analysis. SPECIFY THE OBJECTIVES OF THE ANALYSIS Focus on who is the financial statement user The identity of the user helps define what information is needed. I had better sell that stock ASAP!. The company’s return on equity has dipped considerably over the last period.

E N D
Overview of Financial Analysis • SPECIFY THE OBJECTIVES OF THE ANALYSIS • Focus on who is the financial statement user • The identity of the user helps define what information is needed I had better sell that stock ASAP! The company’s return on equity has dipped considerably over the last period Financial
Steps of a F/S Analysis • Establish objectives of the analysis • Study the industry and relate industry climate to current and projected economic developments - • a growth industry? • a dying industry? • a changing industry? • Develop knowledge of firm and quality of management • Evaluate financial statements using basic tools • Summarize findings • Reach conclusions relevant to established objectives
Potential Financial Statement Users: • Creditors • Investors • Managers • Who else? • What types of questions do each of these users seek answers to?
Data sources • Financial statements (and notes) • Auditor’s report • MD&A • Supplementary schedules • 10K and 10Q reports filed with SEC • Computerized data bases • Info on industry norms/ratios • Info on particular companies/industries/mutual funds • Articles in popular/business press • Websites
Tools for analysis • Common size financial statements • Financial ratios • Trend analysis • Structural analysis • Industry comparisons • Common sense and judgment
Financial Ratio Categories • Liquidity Ratios measure a firm’s ability to meet cash needs as they arise • Activity Ratios measure the liquidity of specific assets and the efficiency of managing assets
Ratio Categories (continued) • Leverage Ratios measure the extent of a firm’s financing with debt relative to equity and its ability to cover interest and other fixed charges • Profitability Ratios measure the overall performance of a firm and its efficiency in managing assets, liabilities and equity
Caution! • Ratios are valuable, BUT….. • They do not provide answers in an of themselves and are not predictive • They should be used with other elements of financial analysis • There are no “rules of thumb” that apply to interpretation of ratios
Profitability Ratios • Gross Profit Margin Gross Profit/Net Sales • Operating Profit Margin Operating Profit/Net Sales • Net Profit Margin Net Earnings/Net Sales • All measure firm’s ability to translate sales dollars into profits
Profitability Ratios (continued) • Return on Investment (or Return on Assets) Net Earnings/Total Assets • Return on Equity Net Earnings/Stockholders’ Equity • Both measure overall efficiency of firm in managing investment in assets and generating return to stockholders
Return on Investment • Return on Investment (ROI) • Net operating income • Income before interest and taxes • Operating assets • Assets held for operating purposes ONLY • i.e. cash, accounts receivable, inventory, plant and equipment Net Operating Income = ROI Average Operating Assets 2005 KD Hatheway-Dial
Understanding ROI ROI = Margin X Turnover Operating Margin Net Operating Income = Sales Sales = Turnover Average Operating Assets 2005 KD Hatheway-Dial
Understanding ROI 5% 12.5% = X 2.5 $10,000 5% 100 X = $200,000 $200,000 = 2.5 $80,000 2005 KD Hatheway-Dial
APPLYING ROI 10% Increased Sales without Any Increase in Operating Assets (assume 6% increase in operating expenses) 23.25% = 8.4545 X 2.75 86% increase with 10% increase in sales $18,600 8.4545 100 X = $220,000 $220,000 = 2.75 $80,000 2005 KD Hatheway-Dial
APPLYING ROI 10% Decrease in operating expenses and no change in sales 36.25% = 14.5% X 2.50 190% increase with 10% decrease in operating expenses $29,000 14.5% 100 X = $200,000 $200,000 = 2.50 $80,000 2005 KD Hatheway-Dial
APPLYING ROI 10% Decrease in operating assets and no change in sales or operating expenses 13.90% = 5.0% X 2.78 11.2% increase with 10% decrease in operating assets $10,000 5.0% 100 X = $200,000 $200,000 = 2.78 $72,000 2005 KD Hatheway-Dial
APPLYING ROI 10% increase in operating assets and 5% change in sales and 3% operating expenses 16.25% = 6.8% X 2.39 30% increase with 10% decrease in operating assets $14,300 6.8% 100 X = $210,000 $210,000 = 2.39 $88,000 2005 KD Hatheway-Dial
Profitability Ratios (continued) • Cash Flow Margin Cash Flow from Operating Activities /Net Sales Measures ability to translate sales into cash (with which to pay bills)
Profitability Ratios (continued) • Cash Return on Assets Cash Flow from Operating Activities /Total Assets Useful comparison to return on investment Indicates firm’s ability to generate cash from utilizing its assets
Liquidity Ratios • Current Ratio Current Assets/Current Liabilities Measures ability to meet short-term cash needs • Quick or Acid Test Ratio Current Assets-Inventory/Current Liabilities Measure ability to meet short-term cash needs more rigorously • Cash Flow Liquidity Ratio Cash+Marketable Securities+Cash Flow from Operating Activities/Current Liabilities Focuses on ability of the firm to generate operating cash flows as a source of liquidity
Activity Ratios • Average Collection Period Accounts Receivable/Average Daily Sales Helps gauge liquidity of accounts receivable (ability to collect cash from customers) • Accounts Receivable Turnover Net Sales/Accounts Receivable Another measure of efficiency of firm’s collection and credit policies
Activity Ratios (continued) • Inventory Turnover Cost of Goods Sold/Inventory Measures efficiency of inventory management • Fixed Asset and Total Asset Turnover Net Sales/Net PP&E (Fixed Asset T/O) Net Sales/Total Assets (Total Asset T/O) Both assess effectiveness in generating sales from investment in assets
Leverage: Debt Ratios • Debt Ratio Total Liabilities/Total Assets • Long-Term Debt to Total Capitalization Long-term Debt/Long-term Debt + Stockholders’ Equity • Debt to Equity Ratio Total Liabilities/Stockholders’ Equity • All three measure extent of firm’s financing with debt
Leverage: Coverage Ratios • Proportion and amount of debt in capital structure is important to analyst • Tradeoff between risk and return • Use of debt involves risk -- commitment to fixed charges • Fixed charges must be COVERED -- following are some ratios to assess coverage
Coverage Ratios (continued) • Times Interest Earned Operating Profit/Interest Expense Indicates how well operating earnings cover fixed interest charges • Fixed Charge Coverage Operating Profit + Lease Payments/Interest Expense + Lease Payments Broader measure of how well operating earnings cover fixed charges
Coverage Ratios (continued) • Cash Flow Adequacy Cash Flow from Operating Activities/ Average Annual Long-Term Debt Maturities Measures firm’s ability to cover long-term debt maturities each year Rationale is that over the long-run operating cash flows must be adequate to cover investing activities financed with debt
Other Ratios • Earnings per Common Share Net Earnings/Average Common Shares Outstanding Indicates return on a per share basis • Price to Earnings Market Price of Common Stock/Earnings per Common Share Expresses a multiple the stock market places on earnings
Other Ratios (continued) • Dividend Payout Dividends per Share/Earnings per Share Shows percentage of earnings paid out to stockholders • Dividend Yield Dividends per Share/Market Price of Common Share Shows rate earned by shareholders from dividends relative to current stock price