Understanding Units of Analysis: Fundamentals for Data Reference in Research
730 likes | 841 Views
This training session focuses on the critical concept of the unit of analysis in research. Through various illustrations, participants learn how to properly identify and define the unit of analysis, which is essential for meaningful data collection and analysis. The discussion includes common pitfalls, such as mixing different units in research requests, and emphasizes the importance of clarity in research objectives. By understanding the relationship between the unit of analysis and the unit of observation, researchers can better navigate data structures and improve secondary data analysis outcomes.

Understanding Units of Analysis: Fundamentals for Data Reference in Research
E N D
Presentation Transcript
Units of Analysis The Basics Chuck Humphrey ACCOLEDS/DLI Training December, 2001
Outline • An illustration • Definitions • Elements of the unit of analysis • Complexity • Data structure
An Illustration A group of students in an econometrics class were sent to the Data Library to find some data for an assignment.
An Illustration A typical request was like this one. “I want to look at crime rates and a person’s level of education.”
An Illustration This request raises problems. • crime rates are usually associated with spatial units or a time series • a person’s education is an attribute of individuals
An Illustration What are we looking for? • does the student want crime rates and the percentage of the population with certain education levels for specific cities? This would be data aggregated over geography.
An Illustration What are we looking for? • does the student want the crime rate for one city over time, such as the number of homicides in Edmonton over the past 40 years. This would be data aggregated over time.
An Illustration What are we looking for? • does the student want the education level of criminals? This would be a special subpopulation of individuals convicted of crimes and consist of a microdata file of criminals.
An Illustration What are we looking for? • does the student want the education level of victims of crimes? This would be a special subpopulation of individuals who were victimized and consist of a microdata file of victims.
An Illustration Looking at crime rates and level of education can differ depending upon the unit of analysis. • individuals • geographic areas • changes over time
An Illustration After walking the student through these steps, he chose to build a model predicting income on the basis of highest educational attainment and a few other variables from the Census individual-level public use microdata file. He completely abandoned his interest in crime!
An Illustration Unfortunately, the student’s initial request not only failed to specify a clear unit of analysis, it included a mix of different units, which suggests that the concept was not understood.
The Point of the Illustration The unit of analysis is fundamental to the data reference interview. Early identification of the unit of analysis will help focus a search on statistics, aggregate data, or microdata.
The Point of the Illustration Furthermore, the unit of analysis is fundamental to secondary data analysis. It may be that knowledge of the unit of analysis is even more crucial in secondary analysis than in primary analysis, where the unit is implicit in the sample design, if not otherwise explicit.
The Point of the Illustration Finally, the unit of analysis is a fundamental characteristic of statistical data structures, which are the formal ways in which data are organized for processing.
Definitions The unit of analysis is the basic entity or object • about which generalizations are to be made based on an analysis, and • for which data have been collected
Definitions How does the unit of analysis relate to the unit of observation? The unit of observation is the entity in primary research that is observed and about which information is systematically collected.
Definitions The unit of observation and the unit of analysis are the same when the generalizations being made from a statistical analysis are attributed to the unit of observation.
Definitions • Unit of Observation • in original data collections, the unit of observation is determined by the method by which observations are selected • Unit of Analysis • the unit of analysis is determined by an interest in exploring or explaining a specific phenomenon
Identifying a Unit of Analysis As hinted in the earlier illustration, the unit of analysis is shaped by three attributes: • Social Phenomena • Time • Space
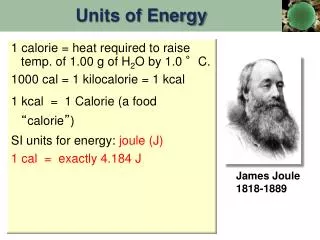
Research Outputs Let’s begin by looking at a finished product to display these attributes. We’ll use a table from the Health Indicators Database about suicide.
Geography and Time held constant Social Characteristics
Geography and Age held constant Ordered by Time
Time and Age held constant Geography Emphasized
Social Phenomena • observations of a single social entity, such as a person or an institution • observations of multiple entities with a defined relationship, such as family, employer-employee
Social Phenomena • transactional observations that are the result of actions among entities, such as labour strikes or international conflicts, including wars
Time • observations made at one point in time; commonly referred to as a cross-sectional study
Time • observations made at multiple points in time • the data may be organized by time; commonly referred to as a time series • time may structure some form of repeated measures of content or subjects
Space • observations made within a specific spatial area • observations made within a hierarchy of spatial areas
Complexity Complexity occurs when multiple types of entities are introduced within the same study. Examples parent child teacher person activity time person car trips
Complexity This complexity can arise within one of the attributes just discussed. • a study of parents, children, and teachers, which are all social units or between attributes • a study of people, their daily activities, and the length of time of each activity
Complexity Complexity is often represented in an hierarchy when the units can be grouped or nested within one another. For example, children may be grouped with their parents.
Parent 1 Parent 2 Child 1 Child 2 Child 3 Complexity Children grouped (nested) with Parents.
Household 1 Household 2 Family A Family A Person i Person i Person ii Person ii Complexity Parents and their children may be grouped into families and families grouped into households.
Complexity Complexity may also be represented by combinations of entities among units. Those entities that are associated with one another are combined and those that aren’t associated, aren’t combined.
Complexity These combinations are often described as having been crossed. For example, activities may be crossed with people.
Activity 1 Activity 2 Person A Activity 4 Activity 3 X Person B Activity 5 Activity 6 = Person A Activity 3 Activity 6 Person B Activity 1 Activity 5 Complexity Activities crossed with people.
Complexity Up to this point, complexity has been described conceptually. We’ve mentioned how multiple units of analysis and the ways in which they are related can create complexity.
Complexity Complexity also manifests itself structurally through the ways in which data are organized to represent the nesting or crossing of multiple units of analysis.
Thinking about Units of Analysis • Conceptually • What is the content? This is what we’ve been reviewing up to this point. • Structurally • How is it organized? This takes us to a discussion about data structure.
Statistical Data Structure Let’s review basic data structure. The unit of analysis defines the underlying structure of a data file.
Statistical Data Structure This structure consists of a series of rows with each row containing the data of one member of the unit of the unit of analysis. This simple structure is known as the flat, rectangular data matrix.
Case 1 Case 2 Case 3 * * * Case n Statistical Data Structure Case n-1
Statistical Data Structure All of the information collected for each member of the unit of analysis is organized in a fixed location in the file called fields or variables.
Field k-1 Field 3 Field k Field2 Field 1 * * Case 1 Case 2 Case 3 * * * Case n Statistical Data Structure Case n-1
Field k-1 Field 3 Field k Field2 Field 1 * * Case 1 Case 2 Case 3 * * * Case n-1 Case n Statistical Data Structure
Statistical Data Structure This structure looks like the grid of a spreadsheet. However, there is one very important difference between a statistical data structure and a spreadsheet.
Statistical Data Structure The spread sheet is organized around individual cells, while the statistical data structure is organized around the rows.
Statistical Data Structure Spreadsheet
Statistical Data Structure Spreadsheet Cell B2 Cell C5 Cell E3 Cell F7