Download
1 / 10
100 likes | 240 Views
Units of analysis, introduction to Stata. Managing stata. Logs, do files. Open data. use "C:ANES_2010_Setup.dta", clear. Frequency distributions. . tab religion Religion | Freq. Percent Cum. --------------------+-----------------------------------

E N D
Managing stata • Logs, do files
Open data • use "C:\ANES_2010_Setup.dta", clear
Frequency distributions . tab religion Religion | Freq. Percent Cum. --------------------+----------------------------------- Baptist | 221 17.33 17.33 Protestant | 262 20.55 37.88 Catholic | 332 26.04 63.92 Mormon | 21 1.65 65.57 Jewish | 28 2.20 67.76 Muslim | 4 0.31 68.08 Hindu | 3 0.24 68.31 Buddhist | 8 0.63 68.94 Pentecostal | 36 2.82 71.76 Eastern Orthodox | 4 0.31 72.08 Other Christian | 140 10.98 83.06 Other non-Christian | 24 1.88 84.94 None | 183 14.35 99.29 Refused/Missing | 9 0.71 100.00 --------------------+----------------------------------- Total | 1,275 100.00
Presidential vote in 2008 . tab presvote_2008 In the 2008 presidential | election, who did you vote | for? | Freq. Percent Cum. ------------------------------+----------------------------------- McCain | 450 46.39 46.39 Obama | 520 53.61 100.00 ------------------------------+----------------------------------- Total | 970 100.00
Presidential vote in 2012 . tab presvote_2012 (In/Assuming you vote in) the | 2012 presidential election, | do you think you will | Freq. Percent Cum. ------------------------------+----------------------------------- Obama | 474 39.97 39.97 1.5 | 299 25.21 65.18 Republican | 413 34.82 100.00 ------------------------------+----------------------------------- Total | 1,186 100.00
Congressional vote in 2010 . tab congvote_2010 Q6C: Which candidate did you | vote for in your Congressional | district in 2010? | Freq. Percent Cum. -------------------------------+----------------------------------- Democrat | 356 46.60 46.60 1.5 | 23 3.01 49.61 Republican | 385 50.39 100.00 -------------------------------+----------------------------------- Total | 764 100.00
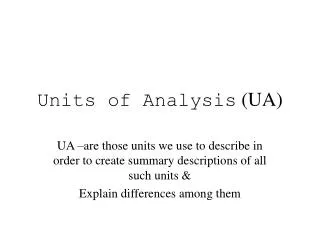
Units of analysis • Time (years, elections, quarterly, days) • People • Geographic units (countries, states)
Datarows = unitscolumns = variables Country population Urban% Religion Austria 8000 58 Catholic Belgium 10100 96 Catholic Bosnia 4600 36 Muslim Bulgaria 8900 68 Orthodox Canada 29100 77 Catholic Croatia 4900 51 Catholic Czech Rep. 10400 72 Catholic Denmark 5200 85 Protestant Finland 5100 60 Protestant France 58000 73 Catholic Germany 81200 85 Protestant Iceland 263 91 Protestant
Female literacy and urban density What are the units in this analysis? R code: library(foreign) #Choose the file `wbdata.dta’ myFile <- file.choose() dat <- read.dta(myFile,header=TRUE) attach(dat) #Make Scatterplot scatterplot(femlifeexp~urbanpctoftotal, reg.line=lm, smooth=TRUE, spread=TRUE, boxplots='xy', span=0.5, data=dat) Stata Code: use wbdata.dta twoway (lfitci femlifeexp urbanpctoftotal) (scatter femlifeexp urbanpctoftotal)