Download
1 / 48
780 likes | 2.26k Views
Mechanism of CO 2 Corrosion Inhibitors. Brian Kinsella Institute for Corrosion and Multiphase Technology (ICMT) Russ College of Engineering and Technology Ohio University Srdjan Nesic, Director of ICMT Yao Xiong (PhD Candidate) ICMT. Summary. Introduction CO 2 Corrosion Inhibitors

E N D
Mechanism of CO2 Corrosion Inhibitors Brian Kinsella Institute for Corrosion and Multiphase Technology (ICMT) Russ College of Engineering and Technology Ohio University Srdjan Nesic, Director of ICMT Yao Xiong (PhD Candidate) ICMT
Summary • Introduction CO2 Corrosion Inhibitors • Thermodynamic of Inhibitor Adsorption using Electrochemical Measurements • Inhibitor Molecular Properties from Quantum Mechanical Calculations – Software • Relating Molecular Properties to Thermodynamics of Adsorption • Atomic Force Microscopy (AFM) to Study Inhibitor Films – Forces of Adhesion
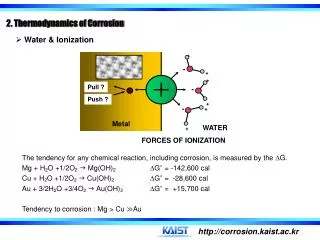
Introduction • Surfactant molecules are used to prevent corrosion of carbon steel from weak acids in oil and gas production. Weak acids include: carbonic (CO2), hydrosulfuric (H2S) and organic acids, in particular acetic acid. Surfactant molecules feature a polar ‘head’ joined to a long chain alkyl group (typically C14 - C18) • The polar head may be + or – charged. • Polar Group: Fatty acids, amines, imidazolines, oxyalkylated amines, oxygen, sulphur and phosphorous (phosphate esters) containing species, quaternary amines
Introduction Hexadecylsuccinic Anhydride The surfactant molecule can adsorb through coulombs type forces or by chemisorption. In the case of hexadecylsuccinic anhydride the molecule react with water to form a di-carboxylic acid which in turn forms an insoluble ferrous salt on the iron surface.
Introduction - Inhibitor Mechanism Conventional Inhibitor Mechanism Oil - Hydrocarbons Hydrophobic Film Surfactant Inhibitor Molecules Steel Surface
c = CMC Oil/Water Interfacial Tension (mN/m) 50 40 c < CMC c > CMC 30 20 Critical Micelle [Micro-emulsion] Concentration (CMC) 10 Log Inhibitor Concentration Surfactant Corrosion Inhibitor Behaviour in Oil Water Systems Nalco Energy Services
SpheresRods Bilayer AFM Images of Surfactant Molecules on MicaSimilar Structures Adsorb on Steel Images obtained using soft contact mode, Si/N cantilever spring constant 0.6 N/m, NaCl brine solution DPC CPC Imidazoline 300 nm 300 nm ShandelleBosenberg Curtin Univeristy
Thermodynamics of Inhibitor Adsorption using Electrochemical Measurements Linear Polarization Corrosion Measurements
Overview • The corrosion rate of steel at different inhibitor concentrations can be fitted to a Temkin adsorption isotherm to determine Kads and Gads. • A Van’t Hoff plot, constructed from Temkin isotherms, i.e. the logarithm of inhibitor concentrations to give 0.5 (surface coverage) at different temperatures, is used to determine the ∆H of adsorption. • Molecular properties, obtained using molecular modelling software, is related to inhibitor performance and the thermodynamics of adsorption.
Corrosion Rate Measurements • Linear polarisation measurements - mild steel electrode polarised ± 10 mV of the corrosion potential using a voltage scan of 0.1 mV/s. • Slope of the resulting i/E curve gives the polarisation resistance Rp.
Calculation of Corrosion Rate • Using Rp, the corrosion current density, Icorris calculated from the Stern Geary equation and inturn the corrosion rate (mm/y) is calculated using Faraday’s law. ba and bc = anodic and cathodicTafel slopes = density of steel
Inhibitor Efficiency/Surface Coverage • The corrosion rate in the absence of inhibitor is representative of the total number of corroding sites. The corrosion rate in the presence of inhibitor is representative of the number of available corroding sites remaining after blockage of sites due to inhibitor adsorption.
Adsorption Isotherms Ln C vs q follows the Temkin adsorption isotherm which is used to deduce fundamental adsorption constants, f and Kads. ln C = fq - ln Kads Left: Temkin Adsorption Isotherm at 30oC where C is the concentration of the inhibitor (mol/L), q is the fractional surface coverage, f is the molecular interaction constant and Kads the equilibrium constant of ads.
Enthalpy of Adsorption • The isosteric enthalpy of adsorption (DHads at a fixed surface coverage) for inhibitor compounds is determined using Van’t Hoff plots. • The effect of temperature on inhibitor performance is evident from Van’t Hoff plots.
Calculating Other Thermodynamic Properties • LnKads from the isotherms • ΔHads from Van’t Hoff plots • ΔGads and ΔSads from the relationships Gads = -30 to -40 kJ mol-1
The next step was to carry out quantum mechanical calculations to determine various molecular properties and relate these properties to the ∆H of adsorption • PCSpartan and HyperChem • Enthalpy of adsorption was better related to a combination of molecular properties, average charge density (rav), molecular size (Vmax), dipole moment (), and the band energy gap () of each molecule. • DHads = k1rav + k2Vmax + k3 + k4 +k5
Negatively charged molecules A plot of the experimentally determined ∆H vs the ∆H determined from molecular properties
Comparison of experimental and predicted concentrations for 50% surface coverage determined from the four-variable fits
Conclusions • Corrosion rates from linear polarisation measurements can be fitted to adsorption isotherms allowing determination of enthalpies of adsorption and thus possible modes of adsorption. The free energy and entropy of adsorption, along with the molecular interaction constant can also be determined. • A reliable semi-empirical model based on coulombic and steric forces has been developed to describe the efficiency of inhibitor molecules. This model can be used in the development of “green inhibitors”
Determining Properties of Inhibitor Films Atomic force microscopy
1990s Performance of inhibitors with fluid flow or shear stress indicated a critical velocity in which the inhibitor film would be removedGads = -30 to -40 kJ mol-1The free energy of adsorption suggests that fluid flow alone cannot remove an inhibitor film
Using a jet impingement cell/loop we performed measurements up to 1200 pa on 21 commercial inhibitor formulations and never reached a critical flow velocity
Critical Micelle Concentration ShandelleBosenberg, Curtin University
Ratio to CMC The performance of surfactant corrosion inhibitors can be related to their CMC which inturn is related to their chain length and the dissolved salt concentration. ShandelleBosenberg, Curtin University
Atomic Force MicroscopyShapes of Surfactants on Mica (2 CMC) film break through DPC CPC C14BDMAC ShandelleBosenberg, Curtin University
Atomic Force Microscopy Shapes of Surfactants on Steel DPC CPC C14BDMAC ShandelleBosenberg, Curtin University
Corrosion inhibitor Hydrophobic tail ~1.8 nm ~2.2 nm Hydrophobic tail Hydrophilic head Hydrophilic head Coco quaternary amine TOFA/DETA Imidazoline • Corrosion inhibitors are surface active compounds (surfactants) that protect metal surfaces by forming adsorption films. Molecular length calculated by Chem Office, Cambridge soft.
Quaternary amineAlkyl Benzyl Dimethyl Ammonium Chloride Compositions: C12-C16 alkyl benzyl dimethyl ammonium chloride (ABDAC) Reported CMC: C12 benzyl dimethyl ammonium chloride: 9 X 10⁻³ M C14 benzyl dimethyl ammonium chloride: 2 X 10⁻³ M C16 benzyl dimethyl ammonium chloride: 5 X 10⁻⁴ M Inhibitor contains 28% C12 compound, 64% C14 compound, 8% C16 compound. A CMC. of 2 X 10⁻³ M was used as C14 is the dominant component.
“Break through” In contact with the film No interaction Penetrating inhibitor film vertically 2~6nm Stress = Force/cross-section area = 1 nN/(3.14*10 nm*10 nm*0.5) = 1.6 Mpa Diameter = ~10 nm
Lateral scratching of inhibitor film Imidazoline, 0.5 CMC; on Mica • Substrate mica • Averaged film thickness: 2.4 nm • Film structure: Monolayer
Film thickness from lateral scratching Imidazoline2 CMC on Mica • On mica substrate • Averaged film thickness: 4.4 nm • Film structure: double layer
Film thickness of inhibitors on mica Thiosulphate has little influence on film thickness
Summary of Penetration Measurements (nN) at 2 CMC Roughness Similar inhibitor types have a similar penetration force while the sodium thiosulphatedoesn’t significantly increase the force, probably because they have similar structures. Increased surface roughness appears to reduce the force to penetrate the inhibitor film. Same penetration force Na2S2O3
Lateral Force Measurements Trace • Scratching inhibitor molecules Retrace • Lateral force contributes to the scratching of inhibitor molecules. • Lateral force is proportional to the normal force applied on AFM probe. • Schematic of lateral movement of AFM tip
Averaged: 53±13 nN Five measurements 0.5 cmc, 1.1±0.2 nN • Cantilever is sensitive in z direction, corresponding to normal force • The lateral spring constant is usually 1~2 magnitude higher than the normal spring constant. • AFM instrument can directly measure normal spring constant. But the lateral spring constant needs to be calculated.
Lateral force measurements Imidazoline0.5 CMC on Mica Trace Retrace Lateral force = [F(trace) – F(retrace)]/2 Normal force loaded on AFM cantilever: ~ 30nN Average lateral force = 53 nN
Lateral force on mica Normal force on AFM cantilever 30 nN Average lateral force = 16 nN
Net lateral force to remove inhibitor film on mica at 0. 5 CMC Lateral force on mica 16 nN Lateral force on mica with inhibitors: ≈53 nN 53 – 16 37 nN force needed to remove inhibitor molecules laterally. These forces are several orders of magnitude above forces that can be achieved by flow alone.
Imidazoline 2 CMC on Mica Averaged lateral force = 55 nN
Imidazoline, on Mica Penetration force (vertical direction) appear to be related to how strong inhibitor molecules can repel outside impact. Lateral force appears to be related to how strong inhibitor molecules can bind to the substrate. Therefore, different substrates, different lateral removal force.
Summary, Inhibitors on Mica • Lateral force is related to the binding of inhibitor molecules to the substrates • Penetration force is related to the structure of adsorbed inhibitor molecules.
Net Lateral Force on Mica and Au • The sodium thiosulphate helps inhibitors bind stronger to Au. – possibly due to the formation of a sulfide film. Results support the hypothesis that the measured lateral force is related to the binding between inhibitor molecules and substrate. Significant difference Na2S2O3
Conclusions • AFM can be used to image surfactant molecules on surfaces, measure film thickness and the forces to penetrate and scratch the inhibitor films • The force to penetrate an inhibitor film is related to the structure of the assembled molecules, which in-turn can be related to the surface roughness of the substrate • The force to scratch or remove inhibitor molecules from a surface is related to the surface adhesive force and appears to have little relationship to film structure • Inhibitor molecules cannot be removed from a surface by the force of fluid flow alone and this is supported by thermodynamic data • Kinetics of inhibitor adsorption can also be possibly studied using AFM