Comparative Oculomotor Examination in Parkinson’s Disease and Related Disorders
10 likes | 104 Views
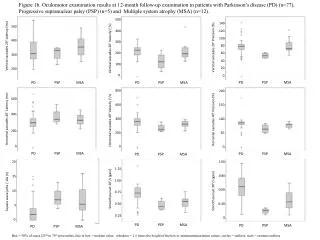
Study comparing vertical and horizontal saccades, smooth pursuit, and square wave jerks in PD, PSP, MSA patients, and controls through baseline examination data. Results presented graphically with descriptive statistics.

Comparative Oculomotor Examination in Parkinson’s Disease and Related Disorders
E N D
Presentation Transcript
Figure 1a. Oculomotor examination results at baseline in patients with Parkinson’s disease (PD) (n=105), Progressive supranuclear palsy (PSP) (n=11), Multiple system atrophy (MSA) (n=19) and controls (n=38). 400 800 250 700 200 300 600 150 Vertical saccades 20° Latency (ms) 500 Vertical saccades 20° Precision (%) 200 Vertical saccades 20° Velocity (°/s) 100 400 100 50 300 200 0 0 PD PSP MSA Controls PD PSP MSA Controls PD PSP MSA Controls PD PSP MSA Controls 700 800 250 600 200 600 500 150 400 Horzontal saccades 40° Latency (ms) Horzontal saccades 40° Precision (%) Horzontal saccades 40° Velocity (°/s) 400 100 300 50 200 200 100 0 PD PSP MSA Controls PD PSP MSA Controls PD PSP MSA Controls 1.20 1.20 14 12 1.00 1.00 10 0.80 0.80 8 Smooth pursuit 20°/s (gain) Smooth pursuit 30°/s (gain) Square wave jerks / 10s (n) 6 0.60 0.60 4 0.40 0.40 2 0.20 0 0.20 0.20 PD PSP MSA Controls PD PSP MSA Controls PD PSP MSA Controls Box = 50% of cases (25th to 75th percentiles, line in box = median value, whiskers = 1.5 times the height of the box or minimum/maximum values, circles = outliers, stars = extreme outliers